
Fig. 5
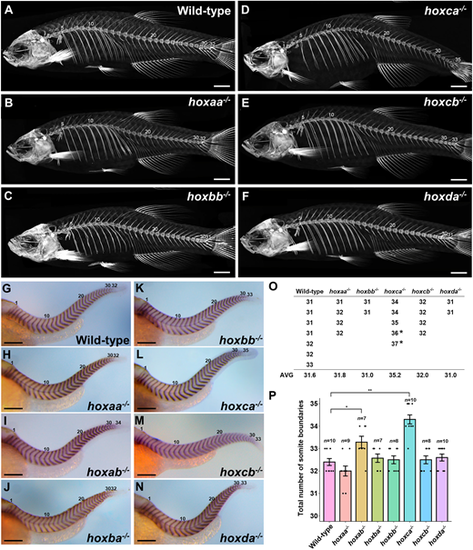
Total numbers of vertebrae and somite boundaries inhoxcluster mutants. (A-F) Whole-body skeletons were analyzed by micro-CT scanning. Adult fish (n=7 for wild-type; n=4 for hoxaa−/−; n=2 for hoxbb−/−; n=3 for hoxca−/−; n=4 for hoxcb−/−; n=2 for hoxda−/−) were examined by micro-CT scanning, and representative images are shown. (G-N) Expression patterns of the segment boundary marker, xirp2a/cb1045, in hox cluster homozygous embryos at 2 dpf. Lateral views. The number of somite boundaries from the anteriormost boundary is indicated. After staining, genotyping was performed. Hemizygous mutants for each hox cluster were indistinguishable from the wild-type. (O) Total numbers of vertebrae in hox cluster mutants. The numbers of vertebrates were counted using micro-CT scan images. In hoxca cluster mutants, two adult fish stained with Alizarin Red were included (indicated by the asterisk). (P) Comparison of the total numbers of somite boundaries in zebrafish hox cluster mutants. The numbers of somite boundaries in the mutants were compared by counting the segment boundaries stained with xirp2a/cb1045. Error bars represent the standard error. *P<0.05, **P<0.01 (two-tailed Student's t-test). Scale bars: 2 mm (A-F); 200 µm (G-N). |