
Fig 4
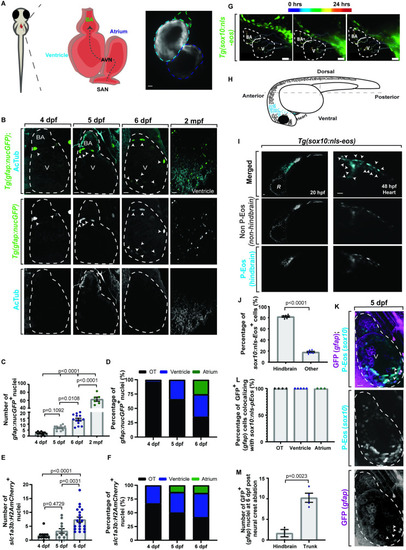
CNG originate from the neural crest and develop in the heart by 4 dpf.
(A) Schematic of embryonic heart showing the BA (green), ventricle (cyan), atrium (dark blue), AVN, and SAN. Blood flows unidirectionally (gray dotted arrow). (B) Confocal maximum z-projections of heart (white dotted outline) at 4, 5, 6 dpf, and 2 mpf Tg(gfap:nucGFP) stained with AcTub. nucGFP+ cells (white arrowheads) increase over time. (C) Quantification of Tg(gfap:nucGFP)+ cell number over time. (D) Quantification of Tg(gfap:nucGFP)+ spatiotemporal location from 4–6 dpf. (E) Quantification of Tg(slc1a3b:myrGFP-P2A-H2AmCherry)+ cell number over time. (F) Quantification of Tg(slc1a3b:myrGFP-P2A-H2AmCherry)+ spatiotemporal location from 4–6 dpf. (G) Confocal maximum z-projection of a 24-hour time-lapse starting at 24 hpf in Tg(sox10:nls-eos) with migration path. Anterior neural crest cells migrate to both the outflow and inflow tract (white dotted outline). (H) Schematic of hindbrain photoconversion in Tg(sox10:nls-eos) embryos. Photoconverted cells are indicated by blue dots. (I) Confocal maximum z-projection of a 24-hour time-lapse starting at 24 hpf in Tg(sox10:nls-eos) with hindbrain neural crest photoconversion (PC). Photoconverted Eos+ cells (white arrowheads) are found throughout the heart. (J) Quantification of percentage of Eos+ cells with a hindbrain neural crest origin. (K) Confocal maximum z-projection of 5 dpf Tg(sox10:nls-eos);Tg(gfap:nucGFP) hearts that are photoconverted in the hindbrain at 24 hpf and stained with GFP at 5 dpf. All GFP+ cells coexpress photoconverted Eos (white arrowheads). (L) Quantification of percentage of GFP+ cells that coexpress photoconverted Eos at 5 dpf. (M) Quantification of number of GFP+ cells at 6 dpf after either hindbrain or trunk neural crest ablation. Data are represented as mean ± SEM. Scale bar equals 10 μm. Statistics summarized in S1 Table. See S1 Data for raw data. AcTub, acetylated tubulin; AVN, atrioventricular node; BA, bulbous arteriosus; CNG, cardiac nexus glia; dpf, days postfertilization; hpf, hours postfertilization; mpf, months postfertilization; OT, outflow tract; R, retina; SAN, sinoatrial node; V, ventricle. |
| Genes: | |
|---|---|
| Fish: | |
| Anatomical Terms: | |
| Stage Range: | 20-25 somites to Day 6 |