
FIGURE
Figure 10
Figure 10
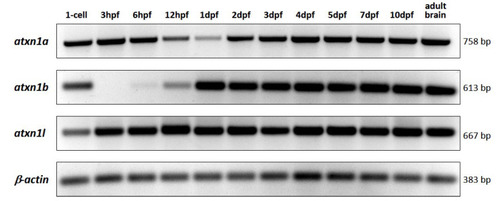
Figure 10. RT-PCR analysis of atxn1 gene expression level in whole-body zebrafish. Total RNA was isolated from embryos and larvae at different developmental stages (single-cell, 3 hpf, 6 hpf, 12 hpf, 1 dpf, 2 dpf, 3 dpf, 4 dpf, 5 dpf, 7 dpf, and 10 dpf) and from adult zebrafish brains. Gene-specific primer pairs for atxn1a, atxn1b, and atxn1l were used to amplify the reverse transcribed cDNAs. The primer pair for β-actin was used as a control. The sizes of the amplicons are given.
|
Expression Data
| Genes: | |
|---|---|
| Fish: | |
| Anatomical Terms: | |
| Stage Range: | 1-cell to Adult |
Expression Detail
Antibody Labeling
Phenotype Data
Phenotype Detail
Acknowledgments
This image is the copyrighted work of the attributed author or publisher, and
ZFIN has permission only to display this image to its users.
Additional permissions should be obtained from the applicable author or publisher of the image.
Full text @ Int. J. Mol. Sci.