
- Title
-
Structural Analysis and Spatiotemporal Expression of Atxn1 Genes in Zebrafish Embryos and Larvae
- Authors
- Vauti, F., Vögele, V., Deppe, I., Hahnenstein, S.T., Köster, R.W.
- Source
- Full text @ Int. J. Mol. Sci.
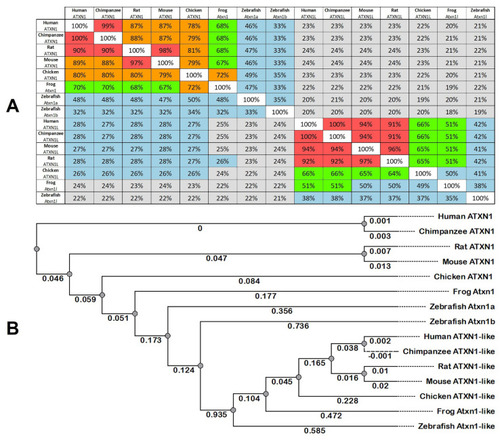
Figure 1. ATXN1 and ATXN1L proteins are highly conserved in vertebrates. (A) Multiple sequence alignment distance matrix indicated for Ataxin-1 proteins (Homo sapiens: NP_001121636.1; Pan troglodytes: XP_001180180.2; Rattus norvegicus: XP_038951298.1; Mus musculus: NP_001186234.1; Gallus gallus: XP_003640803.1; Xenopus tropicalis: XP_002932838.1; Danio rerio: NP_001038291.1; Danio rerio: XP_005158216.1) and Ataxin-1-like proteins (Homo sapiens: NP_001131148.1; Pan troglodytes XP_016885624.1; Mus musculus: NP_001084399.1; Rattus norvegicus: XP_008880885.2; Gallus gallus: XP_015148186.1; Xenopus tropicalis: XP_002938622.1; Danio rerio XP_001333881.2). (B) Phylogenetic tree of Ataxin-1 and Ataxin-1-like amino acid sequences was inferred by the PHYLIP neighbor-joining method (Unipro UGENE software analysis tool) and the Jones–Taylor–Thornton distance matrix model.
|
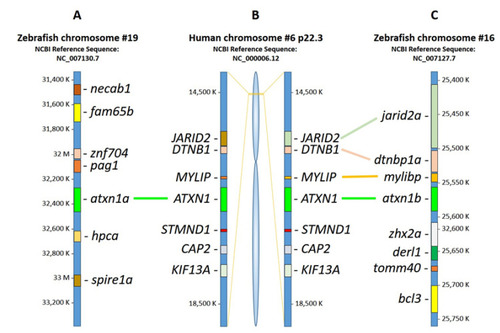
Figure 2. Synteny analysis of human ATXN1 and zebrafish atxn1a and atxn1b. Schematic diagram showing the results of NCBI and Ensembl database analysis. (A) Zebrafish atxn1a is located on chromosome 19 (plus strand), (B) human ATXN1 gene on human chromosome 6p22.3 (minus strand), and (C) zebrafish atxn1b on chromosome 16 (minus strand). Comparative synteny analysis of the human ATXN1 locus shows no synteny to atxn1a genomic regions in zebrafish. In contrast, a flanking region to human ATXN1 encompassing the genomic loci of MYLIP, DTNB1, and JARID2 shows conserved synteny to genomic regions of atxn1b, mylbp, dtnbp1a, and jarid2a in zebrafish.
|
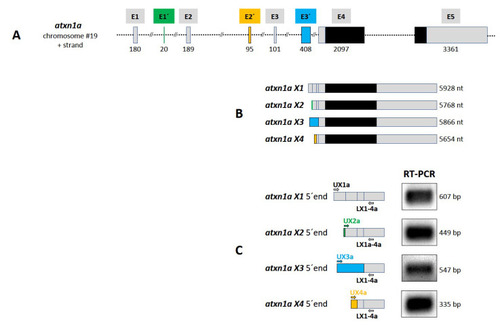
Figure 3. Atxn1a gene in zebrafish. (A) Schematic presentation of the structure of atxn1a gene on chromosome 19 plus strand. The gene consists of eight exons (E1, E1′, E2, E2′, E3, E3′, E4, and E5) containing the coding sequence (black boxes) in the last two exons E4 and E5. (B) Four different transcripts (X1–X4) are predicted in the NCBI database. The atxn1a X1 variant is transcribed from five exons (E1, E2, E3, E4 and E5; grey boxes) such as the X2 variant with the alternative first exon E1′ (green box). The X3 variant contains the alternative exon E3′ (blue box) first, followed by E4 and E5. The X4 transcript variant is encoded by the alternative exon E2′ (orange), followed by sequences from exons E3, E4, and E5. (C) Experimental verification of predicted atxn1a X1–X4 variants. Four different upper primers (UX1a, UX2a, Ux3a, and Ux4a), specific for the alternative exons (shown in A and B), in combination with a lower primer (LX1-4a), specific for exon E4 sequence, were designed for RT-PCR of zebrafish cDNA as template to amplify the 5′ end of each variant (left panel). The lengths of the amplicons (right panel) and the following sequencing confirmed the predicted atxn1a X1–X4 transcript variants.
|
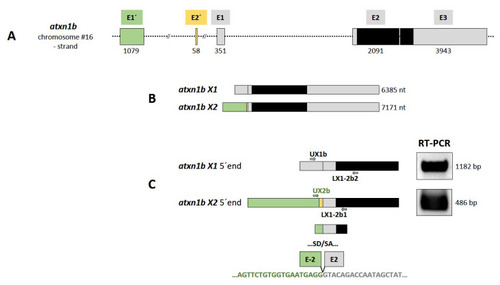
Figure 4. Atxn1b gene in zebrafish. (A) Schematic presentation of the structure of atxn1b gene on chromosome 16 minus strand. The gene consists of five exons (E1′, E2′, E1, E2, and E3) containing the coding sequence (black box) in the last two exons E2 and E3. (B) Two different transcripts (X1 and X2) are predicted in the NCBI database. The atxn1b X1 variant is transcribed from three exons (E1, E2, and E3; grey boxes). The X2 variant contains two alternative exons: E1′ (green box) and E2′ (yellow box) upstream of E1. (C) Experimental verification of predicted atxn1b X1 and X2 variants. Two different primer pairs (UX1b/LX1-2b2 and Ux2b/LX1-2b1) specific for the alternative 5′ exons (shown in A and B) were designed for RT-PCR of zebrafish cDNA templates to amplify the 5′ ends of each variant (left panel). The lengths of the amplicons (right panel) and their sequencing confirmed the predicted atxn1b X1 and X2 (E1′) transcript variants. However, the X2 variant lacks the E2′ sequence (lower panel).
|
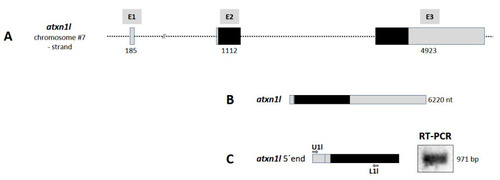
Figure 5. Atxn1l gene in zebrafish. (A) Schematic presentation of the structure of atxn1l gene on chromosome 7 minus strand. The gene consists of three exons (E1, E2, and E3) containing the coding sequence (black box) in the exons E2 and E3. (B) Only one atxn1l transcript is predicted from three exons (E1, E2, and E3; grey boxes). (C) Experimental verification of the predicted atxn1l transcript. The upper primer (U1l), specific for exon E1 sequence, in combination with the lower primer (L1l), specific for exon E3 sequence, were designed for RT-PCR of zebrafish cDNA template to amplify the 5′ end of the transcript (left panel). The length of the amplicon (right panel) and the following sequencing confirmed the predicted atxn1l transcript variant.
|
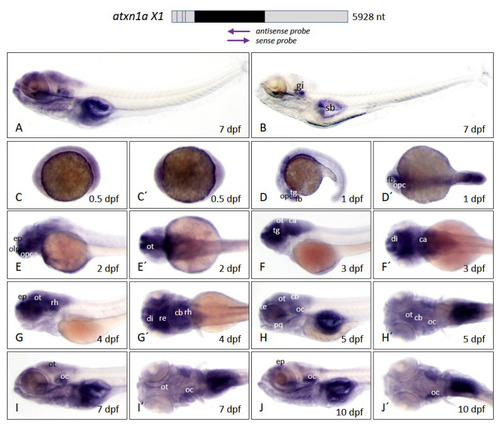
Figure 6. Atxn1a expression pattern in zebrafish embryos and larvae. Whole-mount in situ hybridization was performed in embryos and larvae of the brass line at different developmental stages. (A) Expression domains of atxn1a in whole larva (7 dpf) detected by antisense probes in the coding region of the transcript, indicated by the left arrow below the schematized transcript (upper panel). (B) Sense probes (right arrow, upper panel) indicate background staining in whole larva (7 dpf). Images (C–J) show lateral views and (C′–J′) dorsal views of atxn1a expression domains during embryonic and larval development (0.5, 1, 2, 3, 4, 5, 8, and 10 dpf). Abbreviations: ca (cerebellar anlage), cb (cerebellum), di (diencephalon), ep (epiphysis), fb (forebrain), gi (gills), oc (otic capsule), olp (olfactory pit), opc (optic capsule), ot (optic tectum), pq (palatoquadrate), re (retina), rh (rhombencephalon), sb (swim bladder), te (telencephalon), tg (tegmentum).
EXPRESSION / LABELING:
|
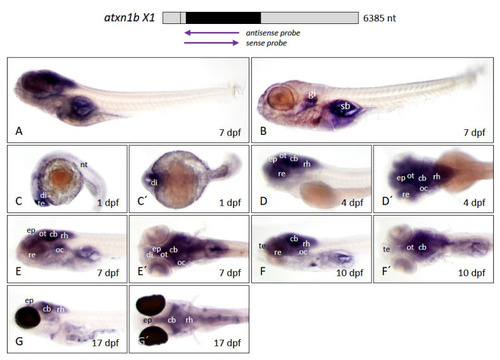
Figure 7. Atxn1b expression pattern in zebrafish embryos and larvae. Whole-mount in situ hybridization was performed in embryos and larvae of the brass and casper line at different developmental stages. (A) Expression domains of atxn1b in whole larva (7 dpf) detected by antisense probes in the coding region of the transcript, marked by the upper left arrow below the schematized transcript (upper panel). (B) Background staining in whole larva (7 dpf) after use of sense probes (right arrow, upper panel). Lateral (C–F) and dorsal (C′–F′) views of atxn1b expression domains of brass zebrafish during embryonic and larval development (1, 4, 8, and 10 dpf). (G) lateral and (G′) dorsal view of atxn1b expression domains in 17 dpf casper larva. Abbreviations: cb (cerebellum), di (diencephalon), ep (epiphysis), gi (gills), nt (neural tube), oc (otic capsule), ot (optic tectum), re (retina), rh (rhombencephalon), sb (swim bladder), te (telencephalon).
EXPRESSION / LABELING:
|
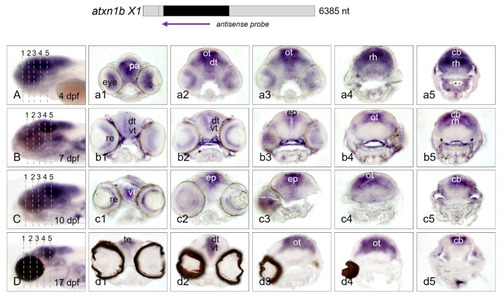
Figure 8. Atxn1b expression domains in cryosectioned zebrafish larvae. Whole-mount in situ hybridization was performed with larvae of the brass and casper line at different developmental stages. Expression domains of atxn1b in whole larva (7 dpf) were detected by antisense probes for the coding region of the transcript (indicated in the upper panel). (A–D) show transverse cryosections (7 µm) of five different regions of the head (left panels). Serial rostral to caudal views of the head region are shown for brass larvae at developmental stages of 4 dpf (a1–a5), 7 dpf (b1–b5), 10 dpf (c1–c5), and for the casper larva at 17 dpf (d1–d5). Abbreviations: cb (cerebellum), dt (dorsal thalamus), ep (epiphysis), ot (optic tectum), pa (pallium), re (retina), rh (rhombencephalon), te (telencephalon), vt (ventral thalamus).
EXPRESSION / LABELING:
|
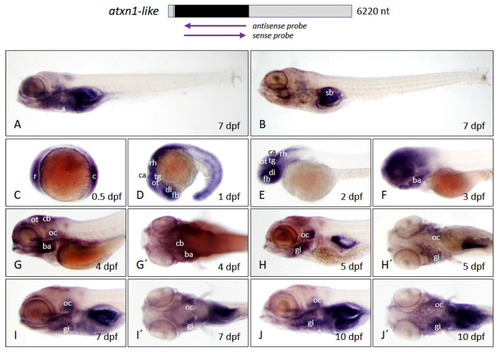
Figure 9. Atxn1l expression pattern in zebrafish embryos and larvae. Whole-mount in situ hybridization was performed in embryos and larvae of the brass line at different developmental stages. (A) Expression domains of atxn1l in whole larva (7 dpf) detected by antisense probes in the coding region of the transcript, marked by the upper left arrow below the schematized transcript (upper panel). (B) Background staining in whole larva (7 dpf) after use of sense probes, (right arrow, upper panel). (C–J) lateral and (G′–J′) dorsal views of atxn1l expression domains during embryonic and larval development (0.5, 1, 2, 3, 4, 5, 8, and 10 dpf). Abbreviations: ba (branchial arches), c (caudal), ca (cerebellar anlage), cb (cerebellum), di (diencephalon), fb (forebrain), gi (gills), oc (otic capsule), ot (optic tectum), r (rostral), rh (rhombencephalon), sb (swim bladder), tg (tegmentum).
EXPRESSION / LABELING:
|
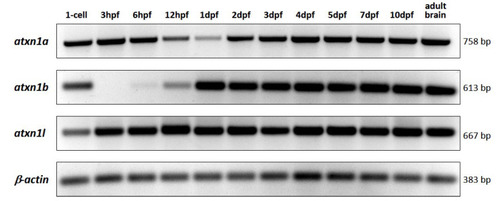
Figure 10. RT-PCR analysis of atxn1 gene expression level in whole-body zebrafish. Total RNA was isolated from embryos and larvae at different developmental stages (single-cell, 3 hpf, 6 hpf, 12 hpf, 1 dpf, 2 dpf, 3 dpf, 4 dpf, 5 dpf, 7 dpf, and 10 dpf) and from adult zebrafish brains. Gene-specific primer pairs for atxn1a, atxn1b, and atxn1l were used to amplify the reverse transcribed cDNAs. The primer pair for β-actin was used as a control. The sizes of the amplicons are given.
|