
Fig. 7
- ID
- ZDB-FIG-211118-41
- Publication
- Guglielmi et al., 2021 - Smad4 controls signaling robustness and morphogenesis by differentially contributing to the Nodal and BMP pathways
- Other Figures
- All Figure Page
- Back to All Figure Page
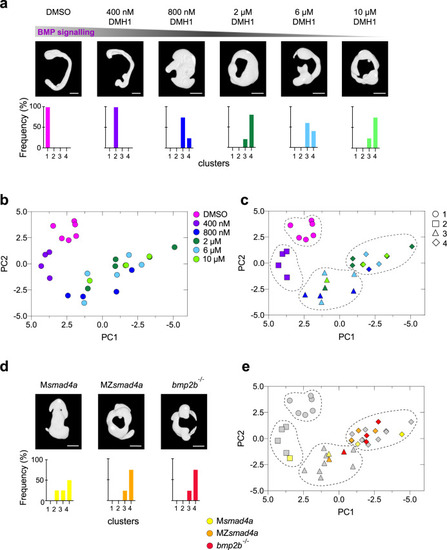
Building a morphometric map for BMP signaling.
a Representative embryos treated with different doses of the BMP inhibitor DMH1 are shown. Bottom panels show the percentage of embryos falling in the different severity clusters defined in c. Scale bars correspond to 260 µm. b Morphometric map for the BMP dose/response. Each embryo is represented as a dot and color coding indicates the DMH1 dose. c As in b, but using hierarchical clustering, which defines four different clusters with different severity. Color coding indicates DMH1 dose; shapes indicate severity groups. d As in a but shows embryo masks for MZsmad4a, Msmad4a, and bmp2b-/- embryos. Scale bars correspond to 260 µm. e MZsmad4a (orange), Msmad4a (yellow), and bmp2b-/- (red) are plotted onto the dose/response morphometric map (gray). Shapes indicate severity group. |
| Genes: | |
|---|---|
| Fish: | |
| Anatomical Terms: | |
| Stage Range: | 75%-epiboly to 20-25 somites |
| Fish: | |
|---|---|
| Condition: | |
| Observed In: | |
| Stage: | Prim-5 |