
Fig. 5.
- ID
- ZDB-FIG-211118-106
- Publication
- Ren et al., 2021 - Novel zebrafish polycystic kidney disease (PKD) models reveal functions of the Hippo pathway in renal cystogenesis
- Other Figures
- All Figure Page
- Back to All Figure Page
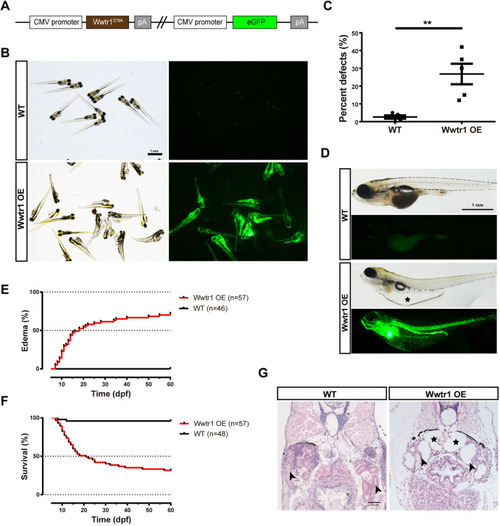
Overexpression of Wwtr1 in zebrafish induces polycystic kidney disease (PKD). (A) Schematic diagram of the expression plasmid for the Wwtr1 overexpression (Wwtr1 OE) fish line. (B) Morphology and fluorescent signal of larvae at 3 dpf. Scale bar: 1 mm. (C) Statistical analysis of embryonic defects in Wwtr1 OE fish and WT fish. **P<0.01 by unpaired two-tailed Student's t-test, mean±s.e.m. (n=5). (D) Morphology of larvae at 18 dpf. The asterisk indicates the edema. Scale bar: 1 mm. (E) Kaplan–Meier plots for the onset of edema in Wwtr1 OE and WT fish. The median time of onset of edema was 18 dpf. Statistical analysis was performed using log-rank (Mantel–Cox) test (P<0.001). (F) Kaplan–Meier plots for survival of Wwtr1 OE and WT fish. The median survival time was 21 dpf. Statistical analysis was performed using log-rank (Mantel–Cox) test (P<0.001). (G) H&E staining of paraffin sections of Wwtr1 OE and WT fish at 18 dpf. Wwtr1 OE fish exhibited glomerular cyst with enlarged Bowman's space (asterisks) and pronephric tubule (arrowheads) dilation. Scale bar: 50 μm. |