FIGURE

Figure 3

ID
ZDB-FIG-211103-32
Publication
Kler et al., 2021 - Cre-Dependent Anterograde Transsynaptic Labeling and Functional Imaging in Zebrafish Using VSV With Reduced Cytotoxicity
Other Figures
All Figure Page
Back to All Figure Page
Figure 3

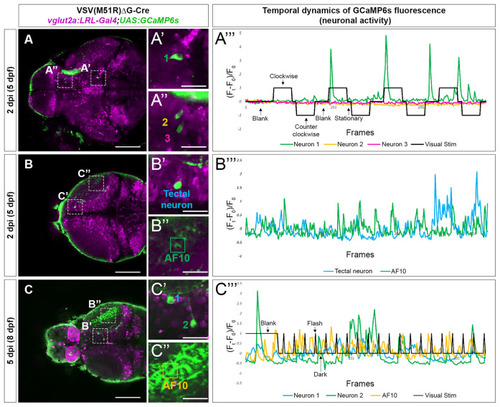
Temporal dynamic of calcium activities in multiple conditions captured from neurons infected with VSV(M51R)ΔG-Cre in vglut2a:LRL-Gal4;UAS:GCaMP6s fish. All images shown are confocal optical sections. (A–A”’) Neurons (A’—neuron in Tegmentum—NucMLF and A”—Dorsal Thalamus neurons) expressing GCaMP6s detected in one XY plain of the brain in a 2 dpi (5 dpf). The evoked transient calcium activity traces (Ft − F0/F0) during whole field display of moving gratings is shown in (A”’). (B–B”’) Anterior tectal neuron (B’) and AF10 (B”), expressing GCaMP6s detected in one XY plain of the brain in a 2 dpi (5 dpf) fish. The spontaneous transient calcium activity traces during uniform illumination (blank) is shown in (C”’). (C–C”’) Tectal neurons (C’) and AF10 (C”), expressing GCaMP6s detected in one XY plain of the brain in a 5 dpi (8 dpf) fish. The evoked transient calcium activity traces during whole-field display of 18 s dark/2 s bright flashes is shown in (C”’). Scale bars in (A–C) are 100 μm. Scale bars in (A’,A”,B’,B”,C’,C”) are 25 μm.

Expression Data

Expression Detail
Antibody Labeling
Phenotype Data

Phenotype Detail
Acknowledgments
This image is the copyrighted work of the attributed author or publisher, and ZFIN has permission only to display this image to its users. Additional permissions should be obtained from the applicable author or publisher of the image. Full text @ Front. Neuroanat.