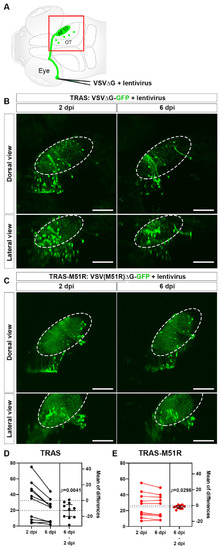
Comparison of VSVΔG and VSV(M51R)ΔG for TRAS labeling. (A) Schematic of TRAS labeling. G-deleted VSV (VSVΔG) and VSV-G pseudotyped lentivirus were co-injected into the temporal retina. This results in VSV infection and reporter gene expression in the RGCs in the retina and subsequent transsynaptic spread to retinorecipient cells in the contralateral brain (green circles). The red boxed area is shown in panels (B,C). OT: optic tectum. AF10: RGC arborization field (AF) 10. (B) TRAS labeling with wild-type VSVΔG-GFP. The same animals were imaged at 2 and 6 days post-infection (dpi) [5 and 9 days post fertilization (dpf)], as indicated. Dorsal views are shown in the top row, and lateral views are shown in the bottom row. The number of VSVΔG infected cells (green cell bodies) was significantly diminished between 2 and 6 dpi. Labeling of RGC arbors within the optic tectum (fibers within the dashed outline) was also significantly reduced. (C) TRAS-M51R labeling with VSV(M51R)ΔG-GFP. The same animals were imaged at 2 and 6 dpi and shown in dorsal and lateral views, as indicated. The number of infected cells and the labeling of RGC arbors were similar between 2 and 6 dpi. (D,E) Estimation plots for changes in retinorecipient cell number between 2 and 6 dpi for TRAS and TRAS-M51R. The left part of the graph side shows the cell number for each fish at 2 and 6 dpi. Dashed lines indicate the means of each time point. The right side of the graph shows the effect size (mean of differences between 2 and 6 dpi). Error bars show the mean and 95% confidence interval (CI). The CI in (D) and (E) do not overlap with 0, indicating a significant decrease in cell number. p values from the two-tailed paired t-test are shown on graphs. Scale bars are 100 μm.

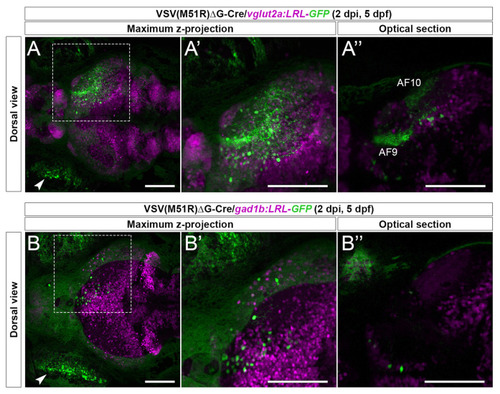
Cre-dependent TRAS-M51R labeling of specific retinorecipient neuron subtypes. (A–A”) Representative image of a 2 dpi (5 dpf) live vglut2a:LRL-GFP larvae injected with VSV(M51R)ΔG-Cre. Boxed area in (A) is shown in higher magnification in (A’; both show maximum z-projection). Panel (A”) shows a single optical section in the box area in (A), at the level of AF9. GFP expression was seen in the injected eye (arrowhead in A), retinorecipient cells (round green cells), and the AFs (AF9 and AF10 shown in A”). (B–B”) Representative image of a 2 dpi (5 dpf) live gad1b:LRL-GFP larvae injected with VSV(M51R)ΔG-Cre. Boxed area in (B) is shown in higher magnification in (B’) (both show maximum z-projection). Panel (B”) shows a single optical section in the box area in (B), at the level of AF9. GFP expression was seen in the injected eye (arrowhead in B) and retinorecipient cells. No AF labeling was seen. Green fluorescence in the uninjected eye was from the autofluorescence of retinal pigment epithelial cells. Scale bars are 100 μm.

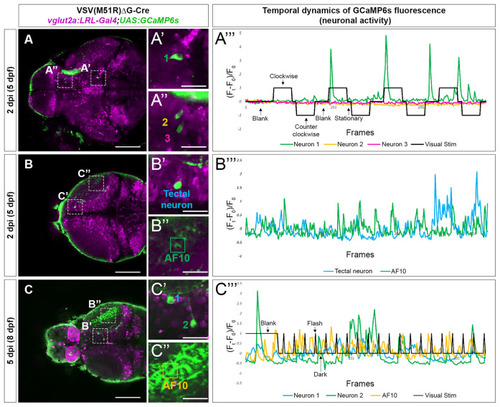
Temporal dynamic of calcium activities in multiple conditions captured from neurons infected with VSV(M51R)ΔG-Cre in vglut2a:LRL-Gal4;UAS:GCaMP6s fish. All images shown are confocal optical sections. (A–A”’) Neurons (A’—neuron in Tegmentum—NucMLF and A”—Dorsal Thalamus neurons) expressing GCaMP6s detected in one XY plain of the brain in a 2 dpi (5 dpf). The evoked transient calcium activity traces (Ft − F0/F0) during whole field display of moving gratings is shown in (A”’). (B–B”’) Anterior tectal neuron (B’) and AF10 (B”), expressing GCaMP6s detected in one XY plain of the brain in a 2 dpi (5 dpf) fish. The spontaneous transient calcium activity traces during uniform illumination (blank) is shown in (C”’). (C–C”’) Tectal neurons (C’) and AF10 (C”), expressing GCaMP6s detected in one XY plain of the brain in a 5 dpi (8 dpf) fish. The evoked transient calcium activity traces during whole-field display of 18 s dark/2 s bright flashes is shown in (C”’). Scale bars in (A–C) are 100 μm. Scale bars in (A’,A”,B’,B”,C’,C”) are 25 μm.

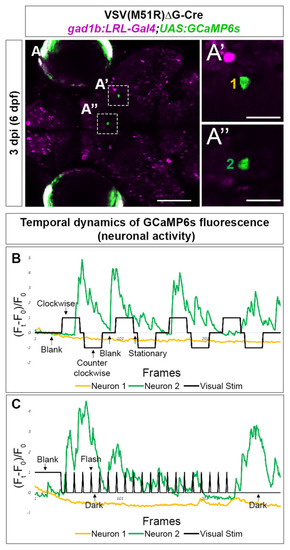
Temporal dynamic of calcium activities in multiple conditions captured from the neurons infected with VSV(M51R)ΔG-Cre in gad1b:LRL-Gal4;UAS:GCaMP6s fish. All images shown are confocal optical sections. (A–A”) Neurons (A’—Mesencephalon neuron and A”—Dorsal Thalamus neuron) expressing GCaMP6s detected in one XY plain of the brain in a 3 dpi (6 dpf) fish. (B) The evoked transient calcium activity traces (Ft − F0/F0) during the whole-field display of moving gratings. (C) The evoked transient calcium activity traces during whole field display of 18-s dark/2-s bright flashes. Scale bar in (A) is 100 μm. Scale bars in (A’,A”) are 25 μm.

Acknowledgments
This image is the copyrighted work of the attributed author or publisher, and ZFIN has permission only to display this image to its users. Additional permissions should be obtained from the applicable author or publisher of the image. Full text @ Front. Neuroanat.