
Fig. 5
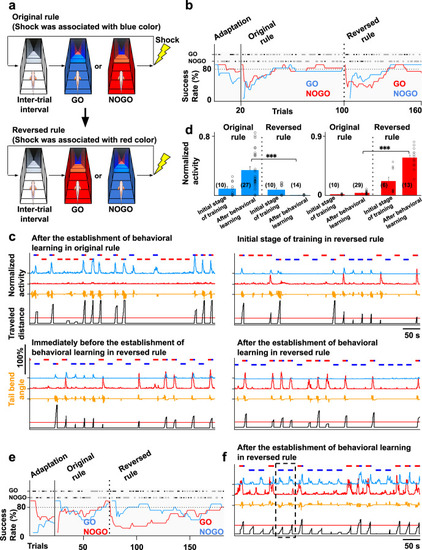
a GO/NOGO tasks with the original and reversed rules. b The learning curve of GO/NOGO trials with the original and reversed rules. Vertical line, initiation of the original rule; vertical dotted line, initiation of the reversed rule. In the adaptation and with the original rule, the success rates of GO and NOGO trials are indicated by blue and red lines, respectively. In the reversed rule, the success rates of GO and NOGO trials are indicated by red and blue lines, respectively. Open circle indicates successful trial. Solid circle indicates failed trial. c The activity of two ensembles after behavioral learning was established with the original rule (upper left panel), immediately after rule change (upper right panel), and immediately before (bottom left panel) and after (bottom right panel) behavioral learning was established with the reversed rule. d Left: comparison of the cyan ensemble’s peak activity in (c) when fish perceived blue color as a starting color with the original and reversed rules in the initial stage of training and after behavioral learning. Columns and error bars: mean ± SEM. Each circle indicates the value in each trial. After behavioral learning of original rule vs after behavioral learning of reversed rule, ***P = 1.80 × 10⁻⁶, F(3, 75) = 14.28. One-way ANOVA, Bonferroni’s multiple comparison test. Right: comparison of the red ensemble’s peak activity in (c) when fish perceived red color as a starting color with the original and reversed rules in the initial stage of training and after behavioral learning. Columns and error bars: mean ± SEM. Each circle indicates the value in each trial. The numbers in parentheses are the number of trials used in the statistics. After behavioral learning of original rule vs after behavioral learning of reversed rule, ***P = 9.73 × 10⁻¹⁰, F(3, 36) = 36.34. One-way ANOVA, Bonferroni’s multiple comparison test. e The learning curve of GO/NOGO trials of another fish in which the cyan ensemble did not disappear. Notations are identical to (b). f The activity of the two ensembles after behavioral learning was established with the reversed rule. The cyan and red lines indicate the ensembles encoding the color rule that blue is dangerous and red is dangerous, respectively. |