|
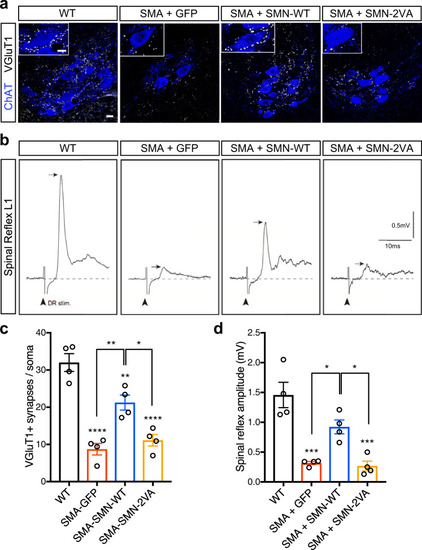
SIM-less SMN fails to rescue sensory-motor circuit dysfunctions in SMA mice.a Immunostaining of VGluT1 + synapses (white dots) and ChAT + MNs (blue) in L1 spinal cord sections from WT mice or SMA mice injected with AAV9-GFP, AAV9-SMN-WT or AAV9-SMN-2VA at P9. Scale bar = 20 µm; scale bar of the insert = 10 µm. b Representative traces of extracellular recordings from L1 ventral root following L1 dorsal root stimulation from WT mice or SMA mice injected with AAV9-GFP, AAV9-SMN-WT or AAV9-SMN-2VA at P9. Arrows indicate the maximum amplitude of the monosynaptic reflex. Arrowheads indicate the stimulus artifact. Scale bars = 0.5 mV and 10 ms. c Number of VGluT1 + synaptic boutons (white dots) on the somata of L1 MNs (blue) from the same groups as in (a) at P9. Data represent mean and SEM from WT, SMA + AAV9-GFP, SMA + AAV9-SMN-WT, and SMA + AAV9-SMN-2VA (average of boutons counted for at least 15 cells from 4 animals for each group, n = 4 animals). Statistical significance was determined by one-way ANOVA with Tukey’s post hoc test (adjusted P values: WT vs. SMA + GFP p < 0.0001; WT vs. SMA + SMN-WT p = 0.0085; WT vs. SMA + SMN-2VA p < 0.0001; SMA + GFP vs. SMA + SMN-WT p = 0.003; SMA + GFP vs. SMA + SMN-2VA p = 0.8208; SMA + SMN-WT vs. SMA + SMN-2VA p = 0.0132). d Quantification of spinal reflex amplitudes recorded from the same groups as in (b) at P9. Data represent mean and SEM (n = 4 animals). Statistical significance was determined by one-way ANOVA with Tukey’s post hoc test (adjusted P values: WT vs. SMA + GFP p = 0.0002; WT vs. SMA + SMN-WT p = 0.0633; WT vs. SMA + SMN-2VA p = 0.0002; SMA + GFP vs. SMA + SMN-WT p = 0.0254; SMA + GFP vs. SMA + SMN-2VA p = 0.9922; SMA + SMN-WT vs. SMA + SMN-2VA p = 0.0157). Significant differences with WT have been reported immediately atop of each bar plot, while comparisons between the other experimental conditions have been graphed with connecting lines.
|