|
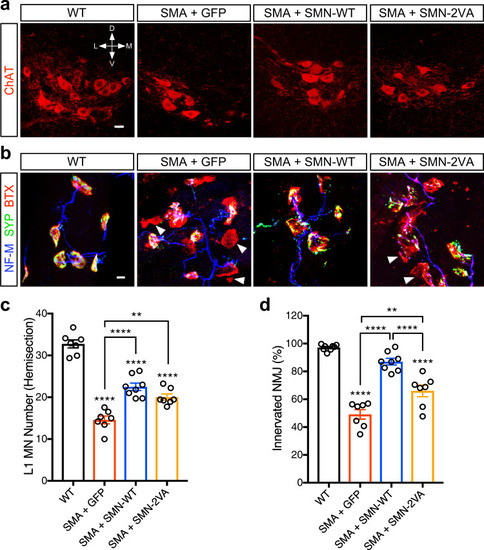
SIM-less SMN partially rescues motor neuron loss and NMJ denervation in SMA mice.a ChAT immunostaining of L1 spinal cords from WT mice or SMA mice injected with AAV9-GFP, AAV9-SMN-WT, or AAV9-SMN-2VA at P9. Scale bar = 20 µm. b NMJ staining with bungarotoxin (BTX, red), synaptophysin (SYP, green), and neurofilament (NF-M, blue) of quadratus lumborum (QL) muscles from the same groups as in (a) at P9. SMN deficiency determines alterations at the NMJ level, affecting their proper innervation (denervated endplates appear as isolated red structures –white arrowheads– without colocalization between bungarotoxin and synaptophysin). Scale bar = 10 µm. c Total number of L1 motor neurons in the same groups as in (a) at P9. Data represent mean and SEM (WT n = 7 animals; SMA + GFP n = 7 animals; SMA + SMN-WT n = 8 animals; SMA + SMN-2VA n = 7 animals). Statistical significance was determined by one-way ANOVA with Tukey’s post hoc test (adjusted P values: WT vs. SMA + GFP p < 0.0001; WT vs. SMA + SMN-WT p < 0.0001; WT vs. SMA + SMN-2VA p < 0.0001; SMA + GFP vs. SMA + SMN-WT p < 0.0001; SMA + GFP vs. SMA + SMN-2VA p = 0.0012; SMA + SMN-WT vs. SMA + SMN-2VA p = 0.2171). d Percentage of fully innervated neuromuscular junctions (NMJs) in the QL muscle from the same groups as in (b) at P9. Data represent mean and SEM (WT n = 9 animals; SMA + GFP n = 7 animals; SMA + SMN-WT n = 8 animals; SMA + SMN-2VA n = 7 animals). Statistical significance was determined by one-way ANOVA with Tukey’s post hoc test (adjusted P values: WT vs. SMA + GFP p < 0.0001; WT vs. SMA + SMN-WT p = 0.0878; WT vs. SMA + SMN-2VA p < 0.0001; SMA + GFP vs. SMA + SMN-WT p < 0.0001; SMA + GFP vs. SMA + SMN-2VA p = 0.0018; SMA + SMN-WT vs. SMA + SMN-2VA p < 0.0001). Significant differences with WT have been reported immediately atop of each bar plot, while comparisons between the other experimental conditions have been graphed with connecting lines.
|