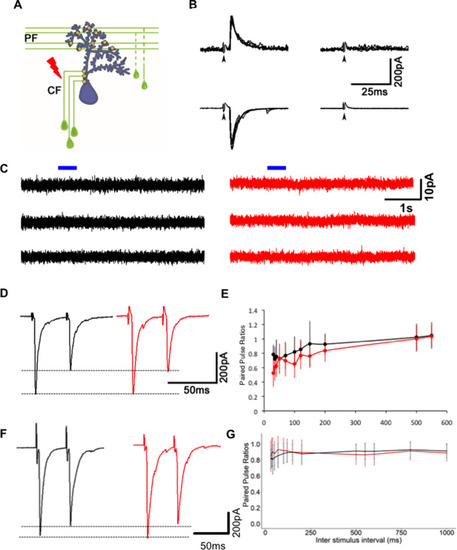
(A) Schematic of experimental setup for stimulating climbing fibers (CFs) while recording EPSCs in Purkinje neurons (PNs; blue). (B) EPSCs recorded at a hyperpolarized holding potential (bottom row traces) and at a depolarized holding potential (top traces) in normal saline (left side traces) and in saline containing the AMPAR blocker CNQX (right-side traces). No EPSCs were detected in the presence of CNQX at −65 or +60 mV at 7 days post fertilization (dpf) (N = 4 cells) or at 19 dpf (N = 2 cells). Data from 19 dpf shown above. (C) Voltage clamp recordings from wild-type (WT) and mutant PNs at 7 dpf at a holding potential of −20 mV show no detectable response to brief pulses (blue bars) of N-methyl-D-aspartate (NMDA). Recordings were done in the presence of 1 µM tetrodotoxin (TTX). (D) Paired pulse depression of EPSCs in PNs of control (black) and Gjd2b-MO-injected (red) larvae. (E) Paired pulse ratios were not significantly different between control and Gjd2b-MO-injected larvae at any of the interstimulus intervals (ISIs) tested (mean ± SD; N = 5 cells from five larvae each in control and Gjd2b-MO groups; two-way repeated-measures ANOVA, p=0.081 for groups [control, Gjd2b-MO] and p<0.001 for ISIs). (F) Paired pulse depression of EPSCs in PNs of WT (black) and gjd2b-/- (red) larvae. (G) Paired pulse ratios were not significantly different between WT and mutant larvae. Mean ± SD; two-way repeated-measures ANOVA, p=0.17 for groups (control, Gjd2b-MO) and p<0.001 for ISI. Data used for quantitative analyses are available in Figure 4—source data 1.