|
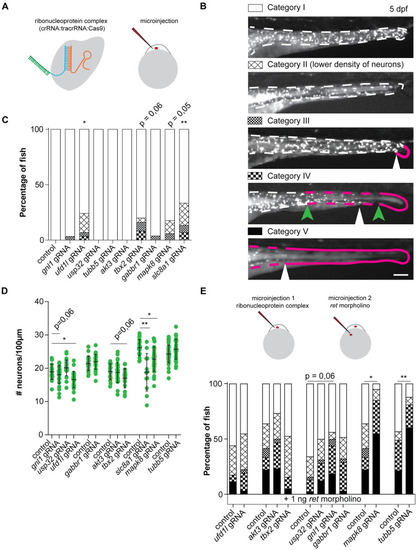
Disruption of candidate genes in zebrafish caused defects in ENS development.(A) Visual representation of the CRISPR/Cas9 complex injections using the Alt-R CRISPR-Cas9 System from Integrated DNA Technologies (IDT) [34]. (B) Legend showing the various phenotypes observed in zebrafish. Larvae are characterized as category I (e.g. ENS not affected) when there is a full colonization of the intestine by phox2bb-GFP+ cells which are dispersed at a density comparable to that observed in untreated animals. Larvae are characterized as category II when there is an overall reduction observed in the presence of phox2bb-GFP+ cells along the total length of the intestine. Larvae are characterized as category III when an absence of phox2bb-GFP+ cells is observed in the most distal part of the gut, depicted by the white arrowhead and magenta line. Category IV classification is used when the phox2bb-GFP+ have migrated into the intestine but only reach in the mid-gut as in the example depicted by the white arrowhead. The green arrowheads as well as the magenta line indicate the range in which fish are categorized as category IV. The most severe alteration in the ENS is categorized as V, where the mid-gut and distal-gut are deprived of neurons, as depicted by the magenta line and the ENS has migrated no further than the white arrowhead. (C) Disruption of four genes induced ENS phenotypes in the zebrafish larvae, of which two were statistically significant (accumulated data from multiple experiments). (D) In line with the observed ENS phenotypes, quantification of the number of neurons per 100μm showed significantly reduced numbers of neurons upon disruption of three genes (accumulated data from multiple experiments). (E) Schematic representation of sequential injection with CRISPR/Cas9 complexes and ATG-blocking ret morpholino. Graph showing accumulated data of the percentage of fish with ENS phenotypes upon injection of a morpholino targeting Ret translation at a concentration that induced ENS phenotypes in approximately 50% of the fish. Ret morpholino injections in combination with disruption of mapk8a/b and tubb5 shows epistasis. Disruption of gnl1 showed a trend towards higher penetrance of ENS phenotypes. Statistical tests used: students t-test (D), one-way ANOVA followed by Dunnett’s multiple comparisons test (D), and "N-1" Chi-squared test (C and E); * p < 0.05 ** p < 0.01 *** p < 0.001; Exact p-values, number of fish per group and statistics can be found in S11 Table.
|