|
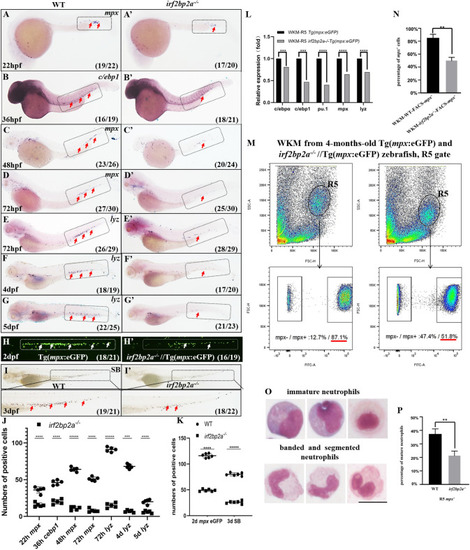
Deficiency of <italic toggle='yes'>irf2bp2a</italic> specifically impairs neutrophils maturation in embryonic and adult zebrafish.(A-G’) WISH analyses of neutrophils markers mpx (A, A’, C-D’), c/ebp1 (B, B’), lyz (E-G’) from 22 hpf to 5 dpf in wild type (WT) and irf2bp2a-deficient embryos. Grey boxes and red arrows indicate the main position of positive cells for each marker. n/n, number of embryos showing representative phenotype/total number of embryos examined. (H, H’) GFP positive cells are decreased in irf2bp2a-/-//Tg(mpx:eGFP) embryos at 2 dpf. (I, I’) Sudan Black positive cells are reduced in irf2bp2a-deficient embryos at 3 dpf. (J) Statistical results for A-G’ (Student t test, N = 5, 16–30 embryos were used for each probe. Each dot represents the mean value of one experiment, which was obtained from the counts of all of the embryos in the same group. Error bars represent mean ± SEM. ***P < 0.001, ****P <0.0001, *****P < 0.00001). (K) Statistical results for H-I’ (Student t test, N = 6, 16–22 embryos were used for each experiment. Each dot represents the mean value of one experiment. Error bars represent mean ± SEM. ****P < 0.0001, *****P <0.00001). (L) Quantitative reverse transcriptase polymerase chain reaction analysis of neutrophils differentiation-related genes in GFP positive cells enriched from Tg(mpx:eGFP) and irf2bp2a-/-//Tg(mpx:eGFP) embryos at 2 dpf. To determine the relative expression rate, data were normalized to the expression level of WT groups (which were set to 1.0) after normalized to the internal control of β-actin (Student t test, N = 5. Error bars represent mean ± SEM. ***P < 0.001, ****P < 0.0001). (M) FACS analysis of GFP positive cells within the R5 gate of WKMs in four-month-old wild type Tg(mpx:eGFP) (left panel) and irf2bp2a-/-//Tg(mpx:eGFP) zebrafish (right panel). (N) Statistical results for M in wild type Tg(mpx:eGFP) and irf2bp2a-/-//Tg(mpx:eGFP) zebrafish. (Student t test, N = 5, each time 1 male and 1 female were used in the WT group and 2 males and 2 females were used in the mutant group. Error bars represent mean ± SEM. **P < 0.01). (O) May-Grünwald Giemsa staining of mpx+ neutrophilss isolated from R5 gate of irf2bp2a-/-//Tg(mpx:eGFP) mutants and siblings. Scale bar, 10 μm. (P) 500 cytospin-collected GFP+ cells were counted on slides. Immature and mature neutrophils were distinguished and quantitated by morphology, and the proportion of mature neutrophils was compared between WT and mutant groups (Student t test, N = 3. Error bars represent mean ± SEM. **P < 0.01).
|