
Fig. 4
- ID
- ZDB-FIG-210816-4
- Publication
- Oldfield et al., 2020 - Experience, circuit dynamics and forebrain recruitment in larval zebrafish prey capture
- Other Figures
- All Figure Page
- Back to All Figure Page
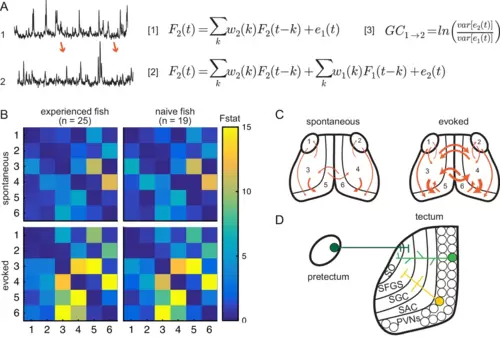
(A) Granger-causality equations (right) to model fluorescence time-series 2 (TS2) using information from TS1 (left). TS1 and TS2: fluorescence from region 4 and 3 respectively for one representative fish. F(t) is fluorescence for time point t; w1 and w2 are the weights calculated for each time point; e denotes prediction error. Figure 4 - equation 1 F2(t)=∑kw2(k)F2(t−k)+e1(t) and Figure 4 - equation 2 F2(t)=∑kw2(k)F2(t−k)+∑kw1(k)F1(t−k)+e2(t) are the autoregressive models for univariate and bivariate signals, respectively. Figure 4 - equation 3 is estimation of Granger-causality level. (B) Average causality level within visual areas in spontaneous (no prey, top row) and evoked (prey present, bottom row) conditions, in prey-experienced (left column) and prey-naïve (right column) fish. Each box represents the F-statistic which quantifies the statistical significance of the directed interaction from the region identified by the row to the region identified by the column. F-statistic values ranged from 0 to 23.7. Fstat values above 15 are yellow. Brain areas shown are: 1, left pretectum; 2, right pretectum; 3, left tectal neuropil; 4, right tectal neuropil; 5, left tectal PVN; 6, right tectal PVN. Significant causal interaction causality link for Fstat > 3.88. No significant difference between prey-experienced and prey-naïve fish in either spontaneous or evoked Granger-causality matrices (pairwise ts, corrected using the Benjamini-Hochberg False Discovery Rate (FDR), see Materials and methods, Behavioral data analysis and statistics; see Supplementary file 2 for p-values). (C) Schematics of functional links in visual areas in spontaneous (left) and evoked (right) conditions. Line width proportional to Granger-causality level (evoked and spontaneous maps indicate links with Fstat > 3.88). (D) Anatomy and known connections of the optic tectum. Dark green: input from pretectum to OT. Bright green: PVNs with dendritic arborization in tectal neuropil. Yellow: axonal projections from PVNs to different layers of OT. SO, stratum opticum; SFGS, stratum fibrosum et griseum superficiale; SGC, stratum griseum centrale; SAC, stratum album centrale. See also Figure 4—figure supplement 1. Data table for panel B in Figure 4—source data 1. |