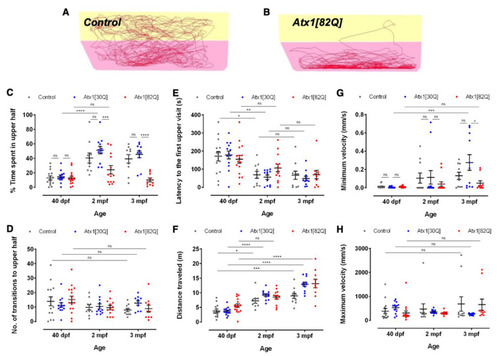
Age-dependent exploratory behavioural comparison of control and hAtx1 expressing zebrafish. Novel tank diving tests were performed with GAPmScarlet, Atx1[30Q], and Atx1[82Q] larvae at 40 dpf, juveniles at two months and young adults at three months of age, respectively. Examples of 6-min traces for (A) a GAPmScarlet control fish and (B) an Atx1[82Q] carrier are shown, the bottom half of the tank is marked in pink, the upper half in yellow. (C) Percentage of time spent in the upper half of the novel tank during a 6-min observation period. (D) Number of entries into upper tank half during the entire observation period. (E) Latency until upper tank half is entered for the first time. (F) Total distance travelled during the entire observation period. (G) Minimal and (H) maximal velocity of swim movements measured during the observation period. Data are presented as mean ± SEM, * p < 0.05, ** p < 0.01, *** p < 0.001 and **** p < 0.0001 (according to two-way ANOVA with post hoc Tukey’s test). n = 14,10,10 in 40 dpf, 2 mpf, and 3 mpf control groups; n = 13, 12, 11 in 40 dpf, 2 mpf and 3 mpf Atx1[30Q] groups; and n = 15, 13, 10 in 40 dpf, 2 mpf, and 3 mpf Atx1[82Q] groups, respectively.
|
