
Figure 5.
- ID
- ZDB-FIG-210725-89
- Publication
- Ma et al., 2021 - Matriptase activation of Gq drives epithelial disruption and inflammation via RSK and DUOX
- Other Figures
-
- Figure 1
- Figure 1—figure supplement 1.
- Figure 2
- Figure 2—figure supplement 1.
- Figure 3
- Figure 3—figure supplement 1.
- Figure 4
- Figure 4—figure supplement 1.
- Figure 5.
- Figure 6.
- Figure 7
- Figure 7—figure supplement 1.
- Figure 8
- Figure 8—figure supplement 1.
- Figure 9
- Figure 9—figure supplement 1.
- Figure 9—figure supplement 2.
- Figure 10
- Figure 10—figure supplement 1.
- Figure 11.
- All Figure Page
- Back to All Figure Page
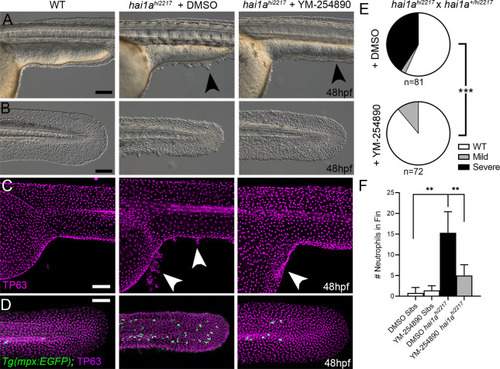
(A–D) Lateral images of ventral trunk and tail at 48hpf for WT (left panels), hai1ahi2217 treated with 0.5% DMSO (middle panels), and hai1ahi2217 treated with 32 µM YM-254890 (right panels). DIC micrographs are shown in (A, B), whilst projected confocal images are shown in (C, D), where embryos are immunostained for TP63 (C, D; magenta) and eGFP (D; green). Embryos in (D) are hemizygous for Tg(mpx:eGFP)i114. Arrowheads indicate region of aggregate formation lost upon treatment with Gq inhibitor YM-254890. (E) Pie charts showing proportion of embryos with no (WT; white), mild (grey) or severe (black) hai1a mutant epidermal phenotypes. Embryos were derived from hai1ahi2217/hi2217 × hai1a+/hi2217 crosses and assayed at 48hpf. Clutches treated with 0.5% DMSO (upper pie chart) were compared to those treated with 32 µM YM-254890 (lower pie chart) by Chi-squared analysis. ***p<0.001; n = 72. (F) Graph of counts of eGFP-positive neutrophils in the fins at 48hpf of Tg(mpx:eGFP)i114, or hai1ahi2217; Tg(mpx:eGFP)i114 treated with 0.5% DMSO, or 32 µM YM-254890. n = 6; Mann–Whitney test; **p<0.01. Scale bars: (A–D) = 100 µm. |