
Fig. 4
- ID
- ZDB-FIG-210715-5
- Publication
- Chambers et al., 2020 - Ppargc1a Controls Ciliated Cell Development by Regulating Prostaglandin Biosynthesis
- Other Figures
- All Figure Page
- Back to All Figure Page
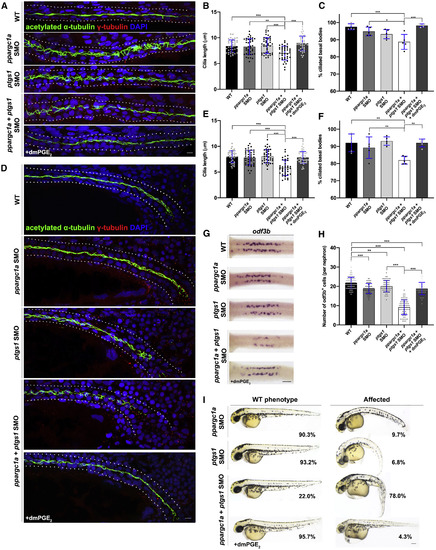
ppargc1a and Prostaglandin Pathway Component ptgs1 Act Together to Properly Form Ciliated Cells
(A) Twenty-eight hours post-fertilization WT (top), ppargc1a suboptimal dose MO (SMO), ptgs1 SMO, ppargc1a + ptgs1 SMO, and ppargc1a + ptgs1 SMO + dmPGE2-treated zebrafish stained via whole-mount immunofluorescence for acetylated α-tubulin (cilia, green), γ-tubulin (basal bodies, red), and DAPI in the proximal pronephros. Scale bar, 7 μm. (B) Cilia length in micrometers for the proximal pronephros. (C) Graph of the percentage of ciliated basal bodies/total basal bodies per 100 μm in the proximal pronephros. (D) Twenty-eight hours post-fertilization WT (top), ppargc1a SMO, ptgs1 SMO, ppargc1a + ptgs1 SMO, and ppargc1a + ptgs1 SMO + dmPGE2-treated zebrafish stained via whole-mount immunofluorescence for acetylated α-tubulin (cilia, green), γ-tubulin (basal bodies, red), and DAPI in the distal pronephros. Scale bar, 7 μm. (E) Cilia length in micrometers for the distal pronephros. (F) Graph of the percentage of ciliated basal bodies/total basal bodies per 100 μm in the distal pronephros. (G) MCCs stained via WISH for odf3b at 24 hpf in WT, ppargc1a SMO, ptgs1 SMO, ppargc1a + ptgs1 SMO, and ppargc1a + ptgs1 SMO + dmPGE2-treated zebrafish. Scale bar, 50 μm. (H) Graph depicting the number of MCCs present. (I) Forty-eight hours post-fertilization zebrafish injected with ppargc1a SMO, ptgs1 SMO, ppargc1a + ptgs1 SMO, and ppargc1a + ptgs1 SMO + dmPGE2-treated displaying either a WT phenotype (left) or an affected phenotype (right). The respective penetrance is listed within each image area. Scale bar, 100 μm. Data are represented as mean ± SD. ∗p < 0.05, ∗∗p < 0.01, and ∗∗∗p < 0.001 (one-way ANOVA); n.s., not significant. |
| Gene: | |
|---|---|
| Antibodies: | |
| Fish: | |
| Condition: | |
| Knockdown Reagents: | |
| Anatomical Terms: | |
| Stage: | Prim-5 |
| Fish: | |
|---|---|
| Condition: | |
| Knockdown Reagents: | |
| Observed In: | |
| Stage Range: | Prim-5 to Long-pec |