
Fig. 1
- ID
- ZDB-FIG-210715-1
- Publication
- Chambers et al., 2020 - Ppargc1a Controls Ciliated Cell Development by Regulating Prostaglandin Biosynthesis
- Other Figures
- All Figure Page
- Back to All Figure Page
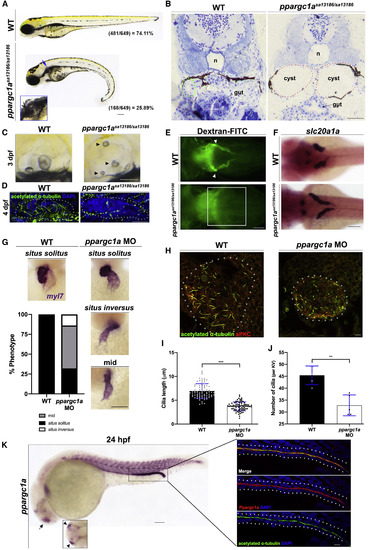
ppargc1a-Deficient Zebrafish Display Phenotypes Commonly Associated with Cilia Defects (A) WT sibling (top) and a ppargc1asa13186/sa13186 mutant (bottom) zebrafish with a curly tail, pronephric cyst (blue arrow, inset), and pericardial edema at 3 dpf. Heterozygous crosses resulted in the expected Mendelian ratio shown at the bottom right of the respective panels (WT group includes homozygous WT and ppargc1a+/sa13186 combined). Scale bar, 90 μm. (B) JB4 transverse section of a 4 dpf WT sibling (left) and ppargc1asa13186/sa13186 mutant (right) zebrafish (n, notochord; tubule outlined in green, cysts outlined in red). Scale bar, 90 μm. (C) Three days post-fertilization WT sibling (left) and ppargc1asa13186/sa13186 mutant (right) otoliths. Arrowheads indicate abnormal otoliths present in the mutant. Scale bar, 90 μm. (D) Four days post-fertilization otic cilia (green, acetylated α-tubulin) of the cristae in WT (left) and ppargc1asa13186/sa13186 mutant (right) zebrafish. Scale bar, 10 μm. (E) Dorsal view of 3 dpf WT sibling (top) and ppargc1asa13186/sa13186 mutant (bottom) approximately 24 h after being injected with 40 kDa dextran-FITC to assay for pronephric function. White arrowheads indicate PCT fluorescence in WT. White box highlights the approximate area of the PCT with no fluorescence. Scale bar, 90 μm. (F) Three days post-fertilization WT sibling (top) and ppargc1asa13186/sa13186 mutant (bottom) stained via WISH for slc20a1a to mark PCT. Scale bar, 90 μm. (G) Fifty-five hours post-fertilization WT and ppargc1a MO injected zebrafish stained via WISH for the heart marker myl7. Penetrance graph of atypical heart looping occurring in WT and ppargc1a morphants. Chi-square analysis indicates significance. n = 128 (WT), n = 103 (MO), p < 0.001. Scale bar, 90 μm. (H) Whole-mount immunofluorescence of the Kupffer’s vesicle (KV) at the 10 ss stained for acetylated α-tubulin (cilia, green), anti-PKC (membrane boundary, red). Scale bar, 8 μm. (I) Cilia length in micrometers of KV cilia. (J) The number of cilia present in the KV. (K) Twenty-four hours post-fertilization WT zebrafish stained via WISH to illustrate ppargc1a mRNA expression. Box is of approximate area of inset showing Ppargc1a (red) expression and the cilia marker acetylated α-tubulin (green). Scale bars, 65 μm for the whole embryo and 10 μm for the inset. Data are represented as mean ± SD; ∗∗p < 0.01 and ∗∗∗p < 0.001 (t test). |
| Genes: | |
|---|---|
| Antibodies: | |
| Fish: | |
| Knockdown Reagent: | |
| Anatomical Terms: | |
| Stage Range: | 10-13 somites to Day 4 |
| Fish: | |
|---|---|
| Knockdown Reagent: | |
| Observed In: | |
| Stage Range: | 10-13 somites to Day 4 |