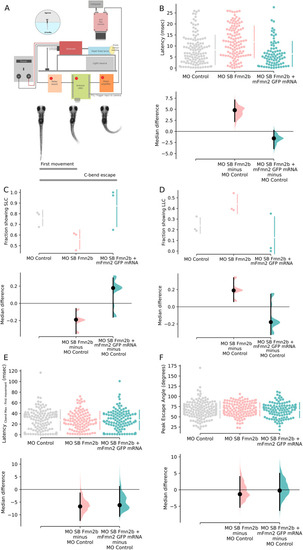
Fmn2b knock-down increased the latency to respond to mechano-acoustic stimulus. Fmn2b knock-down using translation and splice blocking morpholinos (morpholino validation in Extended Data Fig. 2-1A,B) results in deficits in latency to acoustic startle response. Fmn2b morphants without any morphologic defects were used for the following experiments. The morphologic defects are summarized in Extended Data Figure 2-1E,F. Fmn2b morphants do not show any changes in the responsiveness to the acoustic stimuli (Extended Data Fig. 2-1C). A, Schematic of the automated stimulus delivery apparatus and description of movements qualifying as the first movement for latency calculation and maximum C-bend for the escape response following the mechano-acoustic stimulus. B–F, The median difference comparisons against the control morpholino (MO control) are shown in the Cumming estimation plots. The raw data are plotted on the upper axes as individual dots. The vertical gapped lines summarize the median ± SD for each group. On the lower axes, median differences are plotted as bootstrap sampling distributions obtained by resampling the data 5000 times. The median difference is depicted as a dot for respective groups as compared with the shared control. The 95%CI is indicated by the ends of the vertical error bars. B, Latency to first movement (ms) is plotted in this graph. The unpaired median difference between MO control (n = 126) and MO SB Fmn2b (n = 120) is 4.8 [95.0%CI 2.23, 7.1]. The p value of the two-sided permutation t test on the median differences is 0.0. The unpaired median difference between MO control and MO SB Fmn2b + mFmn2-GFP mRNA (n = 83) is −1.58 [95.0%CI −3.89, 0.232]. The p value of the two-sided permutation t test on the median differences is 0.081. The latency to first movement is decreased in Fmn2b morphants injected with the translation blocking morpholino MO TB Fmn2b as compared with the control morphants (Extended Data Fig. 2-1D). C, Values calculated for the fraction of the population (n = 3) showing SLC response (<13 ms) are plotted in this graph. The unpaired median difference between MO control and MO SB Fmn2b is −0.201 [95.0%CI −0.308, −0.107]. The p value of the two-sided permutation t test is 0.0. The unpaired median difference between MO control and MO SB Fmn2b + mFmn2-GFP mRNA is 0.114 [95.0%CI −0.151, 0.266]. The p value of the two-sided permutation t test is 0.357. D, Values calculated for the fraction of the population (n = 3) showing LLC response (13–26 ms) are plotted in this graph. The unpaired median difference between MO control and MO SB Fmn2b is 0.201 [95.0%CI 0.104, 0.303]. The p value of the two-sided permutation t test is 0.0. The unpaired median difference between MO control and MO SB Fmn2b + mFmn2-GFP mRNA is −0.114 [95.0%CI −0.276, 0.111]. The p value of the two-sided permutation t test is 0.29. E, The difference of time taken to achieve the maximum C-bend angle and the latency to first movement for each trial is plotted in this graph. The unpaired median difference between MO control and MO SB Fmn2b is −6.71 [95.0%CI −12.2, −1.4]. The p value of the two-sided permutation t test is 0.0526. The unpaired median difference between MO control and Rescue is −6.2 [95.0%CI −10.6, 1.17]. The p value of the two-sided permutation t test is 0.152. F, This graph shows the maximum angle (C-bend max) attained during the escape response. The unpaired median difference between MO control and MO SB Fmn2b is −1.34 [95.0%CI −5.31, 4.0]. The p value of the two-sided permutation t test is 0.694. The unpaired median difference between MO control and rescue is −0.235 [95.0%CI −6.26, 4.98]. The p value of the two-sided permutation t test is 0.875. For all the estimation statistics analysis, the effect sizes and CIs are reported as effect size (CI width lower bound; upper bound). SLC: Short latency C-bend escapes, LLC: Long latency C-bend escapes.
|
