FIGURE SUMMARY
Title

The Formin Fmn2b Is Required for the Development of an Excitatory Interneuron Module in the Zebrafish Acoustic Startle Circuit

Authors
Nagar, D., James, T.K., Mishra, R., Guha, S., Burgess, S.M., Ghose, A.
Source
Full text @ eNeuro

fmn2b mRNA is maternally deposited and enriched in the zebrafish nervous system. Amino acid sequence alignments were obtained using EMBL Clustal Omega for human Fmn2 (hFmn2), mouse Fmn2 (mFmn2), zebrafish Fmn2b (zFmn2), and chicken Fmn2 (gFmn2) to compare conservation of sequence across vertebrate species. Percent identity matrices are shown for comparison of full length Fmn2 and the functional domains of Fmn2 across species. A, Full-length zFmn2 showed 53.82%, 53.68%, and 54.16% sequence similarity for human, mouse, and chicken Fmn2, respectively. A’, On comparing the functional domains of Fmn2, namely FH1, FH2, and FSI domain, we found 68.34%, 70.43%, and 70.41% sequence similarity with human, mouse, and chicken Fmn2, respectively. B–J, Representative images of whole-mount mRNA in situ hybridization showing the fmn2b mRNA expression pattern in the developing zebrafish embryo. fmn2b mRNA can be found in (B) one cell stage and (C) 3-hpf embryos suggesting maternal deposition. The mRNA expression is negligible during (D) 6 hpf, (E) bud stage, (F) 10-somite, and (G) 15-somite embryos. fmn2b mRNA expression is regained in (H) 24-hpf embryos and continues to be expressed until 96 hpf (I–J’). hpf, hours post fertilization.

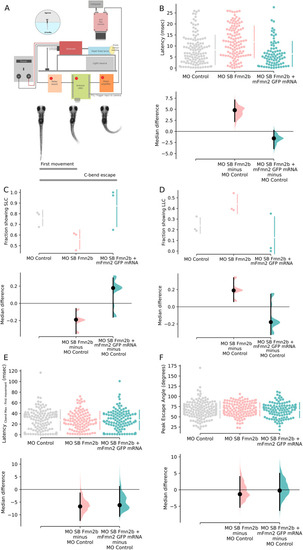
Fmn2b knock-down increased the latency to respond to mechano-acoustic stimulus. Fmn2b knock-down using translation and splice blocking morpholinos (morpholino validation in Extended Data Fig. 2-1A,B) results in deficits in latency to acoustic startle response. Fmn2b morphants without any morphologic defects were used for the following experiments. The morphologic defects are summarized in Extended Data Figure 2-1E,F. Fmn2b morphants do not show any changes in the responsiveness to the acoustic stimuli (Extended Data Fig. 2-1C). A, Schematic of the automated stimulus delivery apparatus and description of movements qualifying as the first movement for latency calculation and maximum C-bend for the escape response following the mechano-acoustic stimulus. B–F, The median difference comparisons against the control morpholino (MO control) are shown in the Cumming estimation plots. The raw data are plotted on the upper axes as individual dots. The vertical gapped lines summarize the median ± SD for each group. On the lower axes, median differences are plotted as bootstrap sampling distributions obtained by resampling the data 5000 times. The median difference is depicted as a dot for respective groups as compared with the shared control. The 95%CI is indicated by the ends of the vertical error bars. B, Latency to first movement (ms) is plotted in this graph. The unpaired median difference between MO control (n = 126) and MO SB Fmn2b (n = 120) is 4.8 [95.0%CI 2.23, 7.1]. The p value of the two-sided permutation t test on the median differences is 0.0. The unpaired median difference between MO control and MO SB Fmn2b + mFmn2-GFP mRNA (n = 83) is −1.58 [95.0%CI −3.89, 0.232]. The p value of the two-sided permutation t test on the median differences is 0.081. The latency to first movement is decreased in Fmn2b morphants injected with the translation blocking morpholino MO TB Fmn2b as compared with the control morphants (Extended Data Fig. 2-1D). C, Values calculated for the fraction of the population (n = 3) showing SLC response (<13 ms) are plotted in this graph. The unpaired median difference between MO control and MO SB Fmn2b is −0.201 [95.0%CI −0.308, −0.107]. The p value of the two-sided permutation t test is 0.0. The unpaired median difference between MO control and MO SB Fmn2b + mFmn2-GFP mRNA is 0.114 [95.0%CI −0.151, 0.266]. The p value of the two-sided permutation t test is 0.357. D, Values calculated for the fraction of the population (n = 3) showing LLC response (13–26 ms) are plotted in this graph. The unpaired median difference between MO control and MO SB Fmn2b is 0.201 [95.0%CI 0.104, 0.303]. The p value of the two-sided permutation t test is 0.0. The unpaired median difference between MO control and MO SB Fmn2b + mFmn2-GFP mRNA is −0.114 [95.0%CI −0.276, 0.111]. The p value of the two-sided permutation t test is 0.29. E, The difference of time taken to achieve the maximum C-bend angle and the latency to first movement for each trial is plotted in this graph. The unpaired median difference between MO control and MO SB Fmn2b is −6.71 [95.0%CI −12.2, −1.4]. The p value of the two-sided permutation t test is 0.0526. The unpaired median difference between MO control and Rescue is −6.2 [95.0%CI −10.6, 1.17]. The p value of the two-sided permutation t test is 0.152. F, This graph shows the maximum angle (C-bend max) attained during the escape response. The unpaired median difference between MO control and MO SB Fmn2b is −1.34 [95.0%CI −5.31, 4.0]. The p value of the two-sided permutation t test is 0.694. The unpaired median difference between MO control and rescue is −0.235 [95.0%CI −6.26, 4.98]. The p value of the two-sided permutation t test is 0.875. For all the estimation statistics analysis, the effect sizes and CIs are reported as effect size (CI width lower bound; upper bound). SLC: Short latency C-bend escapes, LLC: Long latency C-bend escapes.

PHENOTYPE:
Fish:
Knockdown Reagent:
Observed In:
Stage: Day 4

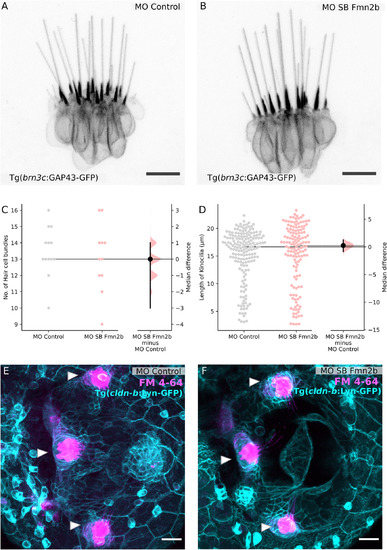
Sensory components of the acoustic startle circuit are not affected in Fmn2b morphants. Hair cells of the lateral crista of the zebrafish inner ear are visualized using the Tg (brn3c:GAP43-GFP) line in 96-hpf larvae with (A) 2 ng MO control and (B) 2 ng MO SB Fmn2b cytoplasmic injections. Scale bar: 10 μm. C, Quantification of the number of hair cell bundles with a kinocilium is depicted in the Gardner–Altman plot. The unpaired median difference between MO control and MO SB Fmn2b is 0.0 [95.0%CI −3.0, 1.0]. The p value of the two-sided permutation t test is 0.687. D, Quantification of kinocilia length in the lateral crista hair cells is shown in the Gardner–Altman plot. The unpaired median difference between MO control and MO SB Fmn2b is 0.247 [95.0%CI −0.851, 1.25]. The p value of the two-sided permutation t test is 0.663. For all the estimation statistics analysis, the effect sizes and CIs are reported as effect size [CI width lower bound; upper bound]. Representative images for FM-4-64 dye uptake assay in the inner ear of 96-hpf (E) control morphants and (F) Fmn2b morphants, done in the background of Tg(cldnb:lyn-GFP) to mark the inner ear boundary. Scale bar: 20 μm.

EXPRESSION / LABELING:
Gene:
Fish:
Knockdown Reagent:
Anatomical Term:
Stage: Day 4

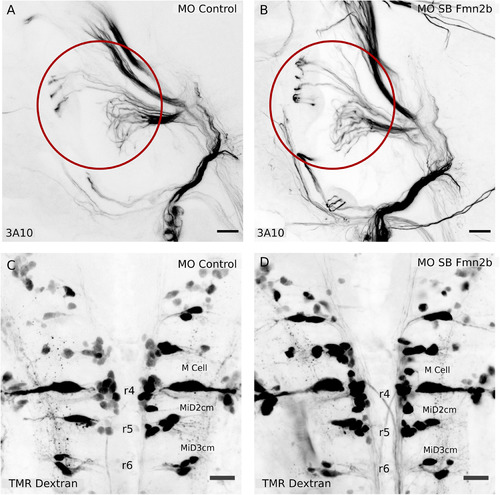
The SAG relaying sensory information and the hindbrain reticulospinal neurons are not affected in Fmn2b morphants. Whole-mount immunostaining with anti-neurofilament antibody 3A10 was used to visualize the SAG connecting to the M-cells in 96-hpf larvae with (A) 2 ng MO control and (B) 2 ng MO SB Fmn2b cytoplasmic injections. Scale bar: 20 μm. Retrograde labeling of reticulospinal neurons using TMR dextran in 96-hpf (C) 2 ng MO control-injected embryos and (D) 2 ng MO SB Fmn2b-injected embryos. The M-cell and its homologs, MiD2cm and MiD3cm, are intact in Fmn2b morphants. Scale bar: 20 μm. The cell bodies of the reticulospinal neurons stained with RMO-44 antibody in 48-hpf morphants are intact in the control and Fmn2b morphants (Extended Data Fig. 4-1).

EXPRESSION / LABELING:
Antibody:
Fish:
Knockdown Reagent:
Anatomical Term:
Stage: Day 4
PHENOTYPE:
Fish:
Knockdown Reagent:
Observed In:
Stage: Day 4

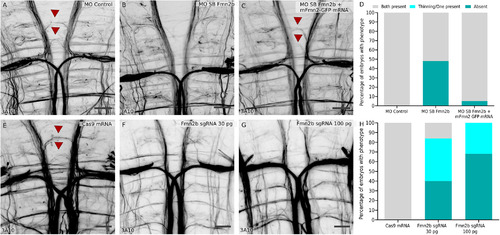
Fmn2b knock-down impairs axonal outgrowth in the spiral fiber tracts. Whole-mount immunostaining using anti-neurofilament antibody 3A10 stains axons in 96-hpf zebrafish hindbrain (A–C, E–G). A, Spiral fiber tracts are marked with red arrowheads in control morphants. B, Fmn2b knock-down using splice blocking morpholino (MO SB Fmn2b; 2 ng/embryo injected in the cytoplasm) reveals defects in the spiral fiber tract outgrowth. The spiral fiber defect is recapitulated with the translation blocking morpholino MO TB Fmn2b in a dose-dependent manner (Extended Data Fig. 5-1A,B). C, The phenotype in Fmn2b morphants could be rescued by injection of 300 pg mFmn2-GFP mRNA in the MO SB Fmn2b-injected embryos at one cell stage. Scale bar: 20 μm. D, A total of 48% Fmn2b morphants (n = 31) show the absence of spiral fiber tracts as compared with none in the control morphants (n = 27). However, only 5% of the embryos rescued with mFmn2-GFP mRNA (n = 40) showed the defects. A χ2 test of independence was performed to compare the three groups, χ2 (df = 2) = 95.75, p < 0.0001. E, Spiral fiber neurons marked with red arrowheads in embryo injected with Cas9 mRNA. F, Fmn2b knock-down using 30-pg dose of each of the two sgRNAs against fmn2b causes defects in the outgrowth of the spiral fiber tracts in Fmn2b crispants. G, Fmn2b knock-down using 100-pg dose of each of the two sgRNAs against fmn2b causes defects in the outgrowth of the spiral fiber tracts in Fmn2b crispants. Scale bar: 20 μm. H, Quantification of the phenotype reveals that Fmn2b crispants injected with 30-pg sgRNAs and Cas9 mRNA (n = 25) show absence of both the spiral fiber tracts in 40% embryos and thinning or absence of only one tract in 44% embryos, as compared with no defects observed in the group injected with the Cas9 mRNA only (n = 27). Fmn2b crispants injected with 100-pg sgRNAs and Cas9 mRNA (n = 28) show an increase in the severity of the phenotype with 67.85% embryos showing absence of both tracts, 32.15% showing thinning or single tract and no embryos with both the spiral fiber tracts intact. A χ2 test of independence was performed to compare the three groups, χ2 (df = 4) = 255, p < 0.0001. Representative images of the single spiral fiber tract outgrowth and thinning of the spiral fiber tract in Fmn2b crispants are included in the Extended Data in comparison to Cas9 mRNA-injected embryos (Extended Data Fig. 5-1C–E). Crispants showed similar morphologic defects during early development when compared with morphants (Extended Data Fig. 5-1F). Various indels and base changes introduced in crispants by co-injection of sgRNA-1 and sgRNA-2 along with Cas9 mRNA are summarized in Extended Data Figure 5-2A,B.

Acknowledgments
This image is the copyrighted work of the attributed author or publisher, and ZFIN has permission only to display this image to its users. Additional permissions should be obtained from the applicable author or publisher of the image. Full text @ eNeuro