
Figure 5
- ID
- ZDB-FIG-210714-37
- Publication
- Lord et al., 2021 - The pattern of Nodal morphogen signaling is shaped by co-receptor expression
- Other Figures
- All Figure Page
- Back to All Figure Page
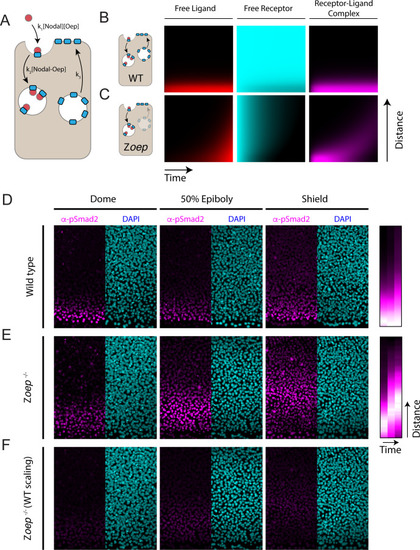
(A) Schematic of model incorporating production and consumption of receptors. Simulations presented here were performed on a one-dimensional tissue with length 300 μm. Oep replacement is assumed to be constant with rate k3, and Oep removal reflects a combination of constitutive and ligand-dependent endocytosis. In panels A and B, simulations are presented as kymographs; each image column shows the state of the system with the source at the bottom and animal pole at the top. Time proceeds from left to right. (B) Simulation of a wild-type gradient. With continual receptor replacement, the system achieves an exponential steady state gradient with length scale set by the ligand diffusion rate and receptor abundance. The free ligand, free receptor, and receptor-ligand complex concentrations are plotted from left to right in red, cyan, and magenta, respectively. (C) Simulation of gradient formation in a zygotic oep mutant. Simulation details are identical to (B), but with receptor replacement rate (k3) set to zero. The system fails to establish a steady state due to gradual consumption and degradation of receptors. Over time, the Nodal ligand gradient expands (red) to drive a propagating wave of signaling activity (i.e. receptor occupancy, magenta). (D) Time course of Nodal signaling activity in wild-type embryos. Representative α-pSmad2 (magenta) and DAPI (cyan) are shown for dome, 50% epiboly and shield stages (left, middle and right panels, respectively). Compilation of signaling gradients across replicates (far right) shows the establishment of the signaling gradient. Composite gradients were derived from 5, 6, and 6 replicate embryos for dome, 50% epiboly and shield stages, respectively. (E) Time course of Nodal signaling activity in zygotic oep mutants. Over time, the signaling pattern evolves from a gradient (dome stage) to a band displaced far from the margin (shield) as the wave travels outward. Compilation of signaling gradients across replicates (far right) illustrates the outward propagation of signaling. Composite gradients were derived from 7, 6, and 3 replicate embryos for dome, 50% epiboly, and shield stages, respectively. (F) Time course of Nodal signaling activity in zygotic oep mutants presented with pixel scaling equal to that used in (D). In accord with simulations, the wave of signaling propagates with a lower intensity than signaling at the margin of wild-type embryos. |