
Figure 2—figure supplement 3.
- ID
- ZDB-FIG-210714-33
- Publication
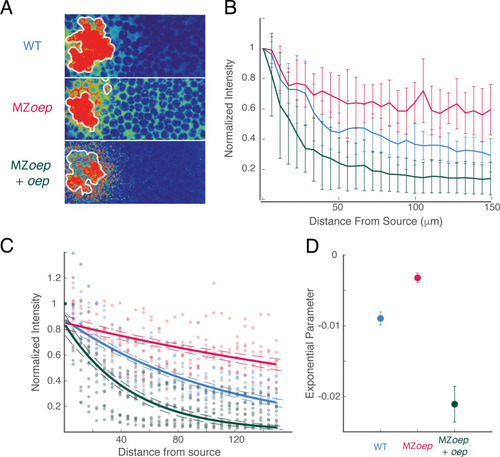
- Lord et al., 2021 - The pattern of Nodal morphogen signaling is shaped by co-receptor expression
- Other Figures
- All Figure Page
- Back to All Figure Page
( |