FIGURE

Figure 2.

ID
ZDB-FIG-210709-2
Publication
DuMez et al., 2021 - In vivo characterization of carbon dots-bone interactions: toward the development of bone-specific nanocarriers for drug delivery
Other Figures
All Figure Page
Back to All Figure Page
Figure 2.

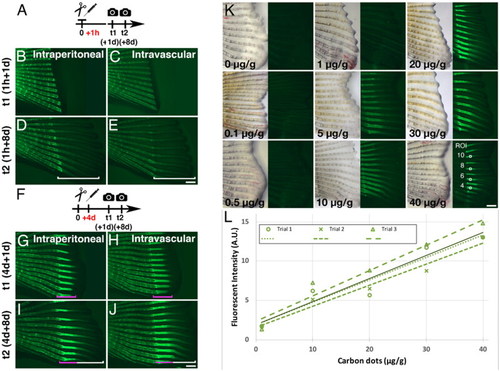
C-dots bind to regenerating bones in a concentration-dependent manner. (A) Schematic representation of regeneration experiment in (B)–(E), were C-dot injection followed caudal fin amputation by 1 h. (B–E) Intraperitoneal (B, D) or intravascular (C, E) injection of C-dots before regeneration begins does not label regenerating bone. Images were taken 1 (B, C) and 8 (D, E) days after C-dot injection. (F) Schematic representation of regeneration experiment in (G)–(J), were C-dot injection followed caudal fin amputation by 4 days. (G–J) Intraperitoneal (G, I) or intravascular (H, J) injection of C-dots after caudal fin regeneration has initiated label the bone being regenerated at the time of injection (magenta bracket), but not bone that regenerated after the injection (white bracket). Images were taken 1 (B, C) and 8 (D, E) days after C-dot injection. n = 6 fish per experimental condition, in two independent experiments. For all experiments, times 1 and 2 images (t1, t2) are of the same fish. (K) C-dots deposition on regenerated bones correlates with concentration of C-dots injected. Timeline of experiment as in F, except that images were collected 4 days post injection. C-dots’ concentration was normalized to fish weight (µg/g; 0 is saline-injected control). Representative regions of interest (ROI) used for fluorescence intensity quantification are indicated with squares for the 40 µg/g injected fish fin. (L) Mean fluorescent intensity of bone-bound C-dots at ROIs as a function of C-dots dosage. Values were normalized to background and saline-injected controls and reported in arbitrary units (A.U.). Dashed lines represent trendlines for three independent experiments (R2 > 0.91; df = 3, p < 0.006), with the solid line representing the mean average trendline (R2 > 0.96; df = 3, p < 0.002). Scale bars are 500 µm.

Expression Data

Expression Detail
Antibody Labeling
Phenotype Data

Phenotype Detail
Acknowledgments
This image is the copyrighted work of the attributed author or publisher, and ZFIN has permission only to display this image to its users. Additional permissions should be obtained from the applicable author or publisher of the image. Full text @ Drug Deliv