
- Title
-
In vivo characterization of carbon dots-bone interactions: toward the development of bone-specific nanocarriers for drug delivery
- Authors
- DuMez, R., Miyanji, E.H., Corado-Santiago, L., Barrameda, B., Zhou, Y., Hettiarachchi, S.D., Leblanc, R.M., Skromne, I.
- Source
- Full text @ Drug Deliv
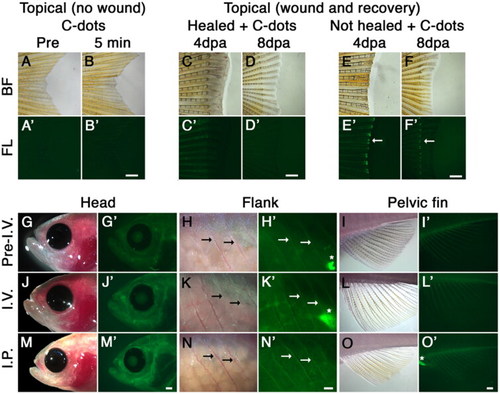
C-dots binding to adult ossified tissue. (A, B) Bright field (BF; A, B) and fluorescent (FL; A’, B’) images of caudal fins before (A, A’) and 5 min after (B, B’) cutaneous exposure of C-dots to skin (2 min; 2 µg/ml). (C, D) Similar to B, cutaneous exposure of C-dots to a healed wound 4 and 8 days post amputation (dpa) does not label local bones. (E, F) Cutaneous exposure of caudal fins to C-dots immediately after amputation resulted in bone labeling at the wound site (E, E’; green fluorescence; white arrow). Four days later, C-dots can be observed in bone tissue at the wound site, but not in new bone tissue (F, F’). (G–I) Images of head, flank and pelvic fin of fish prior to intravascular injection (Pre-I.V.) of C-dots under reflected bright field and epi-fluorescent illumination. Thick tissues naturally display a low level of background fluorescence. (J–L) Intravascular injection (I.V.) of C-dots resulted in fluorescent labeling of ossified tissue 1 h after injection. (M–O) Intraperitoneal injection (I.P.) of C-dots also resulted in fluorescent labeling of bones 1 h after injection. |
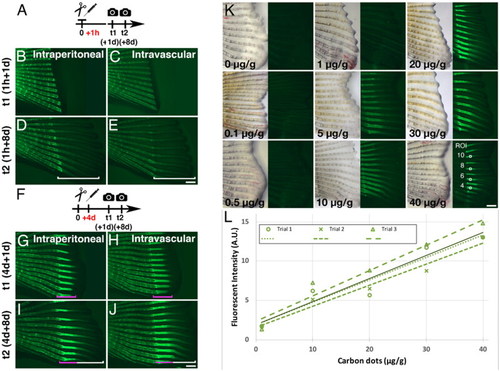
C-dots bind to regenerating bones in a concentration-dependent manner. (A) Schematic representation of regeneration experiment in (B)–(E), were C-dot injection followed caudal fin amputation by 1 h. (B–E) Intraperitoneal (B, D) or intravascular (C, E) injection of C-dots before regeneration begins does not label regenerating bone. Images were taken 1 (B, C) and 8 (D, E) days after C-dot injection. (F) Schematic representation of regeneration experiment in (G)–(J), were C-dot injection followed caudal fin amputation by 4 days. (G–J) Intraperitoneal (G, I) or intravascular (H, J) injection of C-dots after caudal fin regeneration has initiated label the bone being regenerated at the time of injection (magenta bracket), but not bone that regenerated after the injection (white bracket). Images were taken 1 (B, C) and 8 (D, E) days after C-dot injection. |

C-dots distribute evenly throughout available regenerating bones. (A) C-dots deposit on available regenerating bone at time of injection. Injection days after amputation are indicated on the left. Specimens were imaged 8 days after amputation, anterior to the left. Site of the cut is indicated with a blue line, and the site of the profile intensity analysis with a yellow dashed line. Experiments were done in duplicate, with three fish per trial. Scale bar is 500 µm. (B) Fluorescent intensity quantification profile across the length of the fourth ventral fin ray (bone), in two representative fish from two independent experiments. Fluorescent signal in arbitrary units (A. U.) was normalized to saline-injected controls. Blue line indicates the site of amputation, black dots indicate the position where fluorescence in regenerating bone reaches average background fluorescence levels (non-regenerated portion of the bone; dashed line), and black line indicates the position where average fluorescence levels in both specimens reach background levels (except in 7-day fish, were average for trial 2 fish reaches background levels twice; gray dot). |
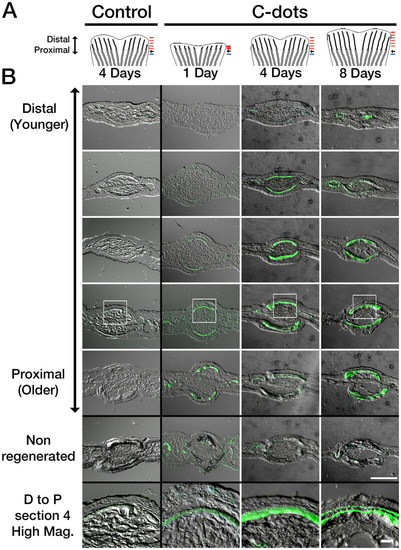
Differential spatiotemporal deposition of C-dots in regenerating bones. (A) Diagram of regenerating fins used in analysis. Amputated fish were injected with saline (control) or C-dots at the indicated times. One hour after injection, fins were re-amputated and processed for cryosectioning. Black arrow indicates amputation site. Red and blue lines indicate the approximate site of sections in regenerating and non-regenerating bones, respectively. (B) Sagittal sections of regenerated and non-regenerated caudal fins ordered in distal (younger) and proximal (older) direction (position corresponding to red and blue lines in A, respectively). Areas of C-dot deposition are green. Areas in white box are shown magnified in the bottom panels. Scale bar is 100 µm for low and 20 µm for high magnification images. |
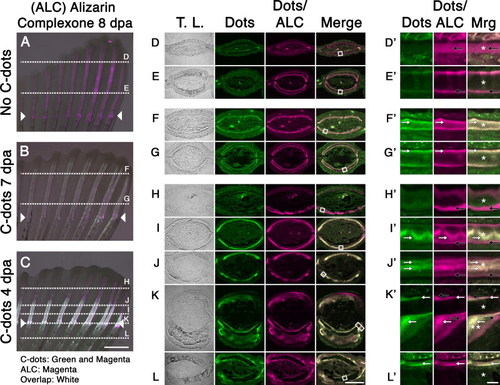
C-dots deposit at sites of active bone mineralization. (A–C) Regenerated caudal fin of uninjected fish (A), injected with C-dots at 7 dpa (B), or injected at 4 dpa (C). All fish were stained with Alizarin Complexone (ALC) at 8 dpa and imaged. Composite images were generated by superimposing photographs obtained using transmitted light, a 488/525 nm filter set to capture C-dots’ fluorescence (pseudo colored green), and a 596/615 nm filter set to capture C-dots/ALC’s fluorescence (pseudo colored magenta). ALC-positive areas (indicative of ossification) that lack C-dots appear magenta, and areas of ossification with C-dot deposition appear white. Posterior end of fin toward top of images. Site of amputation is indicated with arrowheads and the plane of sections (D)–(L) are indicated with dotted lines. (D–L) Transverse sections of fins, imaged and pseudo colored as in (A)–(C). (D’–L’) Magnified bone regions from D–E (white squares). Areas of C-dot deposition are indicated with white arrows. Ossified regions devoid of C-dots are indicated with black arrows. Asterisks indicate the bone matrix. Double asterisk in K’ indicates areas of matrix buildup at the site of amputation. Scale bars are 500 µm for (A)–(C), 50 µm for (D)–(L) and 5 µm for (D’)–(L’). |