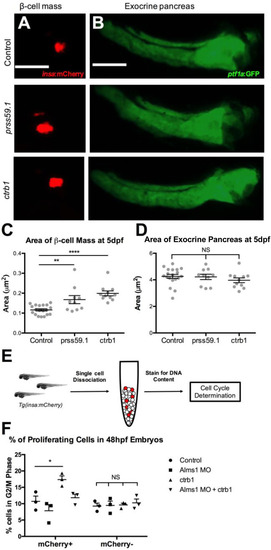
Protease overexpression specifically increases β-cells by induction of proliferation. (A) insa:mCherry expression at 5 dpf representing total area of the β-cell mass in control, prss59.1 mRNA, and ctrb1 mRNA injected animals. Scale bar: 100 μm. (B) ptf1a:GFP expression at 5 dpf representing total area of the exocrine pancreas in control, prss59.1 mRNA, and ctrb1 mRNA injected animals. Scale bar: 100 μm. (C) Quantification of area of mCherry fluorescence of β-cell mass in control (n=19), prss59.1 mRNA (n=10), and ctrb1 mRNA (n=11) injected animals at 5 dpf. (D) Quantification of area of GFP fluorescence of exocrine pancreas in control (n=19), prss59.1 mRNA (n=10), and ctrb1 mRNA (n=11) injected animals at 5 dpf. (E) Schematic of experimental design for cell cycle determination of β-cells in zebrafish embryos at 48 hpf. (F) Quantification of proliferating β-cells (mCherry+) and non-β-cells (mCherry−) by percentage of cells in G2/M phase in control, alms1 MO, ctrb1 mRNA, and alms1 MO plus ctrb1 mRNA injected animals at 48 hpf (n=3 experiments; each experiment represents n=50 embryos). All statistics, Ordinary one-way ANOVA, error bars represent standard error of the mean, symbols represent the following significance: NS=P>0.05, *=P<0.05, **=P<0.01, ****=P<0.0001.
|
