FIGURE SUMMARY
Title

Exocrine pancreas proteases regulate β-cell proliferation in zebrafish ciliopathy models and in murine systems

Authors
Hostelley, T.L., Nesmith, J.E., Larkin, E., Jones, A., Boyes, D., Leitch, C.C., Fontaine, M., Zaghloul, N.A.
Source
Full text @ Biol. Open

Exocrine pancreas proteases contribute to β-cell production. (A) Brightfield image of representative 5 dpf larva shown, boxed area indicates location of pancreas. Scale bars: 500 μm (left) and 100 μm (right). (B) Visualization of individual mCherry-expressing β-cells in control and protease mRNA injected Tg(ins:mCherry) larvae at 5 dpf. Scale bar: 10 μm. (C) β-cell count in control (n=24) and protease mRNA (n=24 for five each) injected animals at 5 dpf. (D) β-cell count in control (n=26), alms1 MO (n=29), and alms1 MO plus protease mRNA (n=26, 29, 22 and 23, respectively) injected larvae at 5 dpf. a=* compared to control, b=** compared to alms1 MO, and c=* compared to alms1 MO. (E) β-cell count in control (n=27), bbs1 MO (n=26), protease MO (n=29 for both), and bbs1 MO plus protease MO (n=26 and 29, respectively) injected larvae at 5 dpf. (F) β-cell count in control (n=29), ctrb1 mRNA (n=38), catalytically dead (D)-ctrb1 mRNA (n=40), inactivatable (I)-ctrb1 mRNA (n=31), and both catalytically dead and inactivatable (D/I)-ctrb1 mRNA (n=35) injected animals at 5 dpf. (G) β-cell count in control (n=29), alms1 MO (n=30), and alms1 MO plus: ctrb1 mRNA (n=40), catalytically dead (D)-ctrb1 mRNA (n=35), inactivatable (I)-ctrb1 mRNA (n=33), or both catalytically dead and inactivatable (D/I)-ctrb1 mRNA (n=30) injected larvae at 5 dpf. All statistics, Ordinary one-way ANOVA, error bars represent standard error of the mean, symbols represent the following significance: NS=p>0.05, *=P<0.05, **=P<0.01, ***=P<0.001, ****=P<0.0001.

Protease overexpression specifically increases β-cells by induction of proliferation. (A) insa:mCherry expression at 5 dpf representing total area of the β-cell mass in control, prss59.1 mRNA, and ctrb1 mRNA injected animals. Scale bar: 100 μm. (B) ptf1a:GFP expression at 5 dpf representing total area of the exocrine pancreas in control, prss59.1 mRNA, and ctrb1 mRNA injected animals. Scale bar: 100 μm. (C) Quantification of area of mCherry fluorescence of β-cell mass in control (n=19), prss59.1 mRNA (n=10), and ctrb1 mRNA (n=11) injected animals at 5 dpf. (D) Quantification of area of GFP fluorescence of exocrine pancreas in control (n=19), prss59.1 mRNA (n=10), and ctrb1 mRNA (n=11) injected animals at 5 dpf. (E) Schematic of experimental design for cell cycle determination of β-cells in zebrafish embryos at 48 hpf. (F) Quantification of proliferating β-cells (mCherry+) and non-β-cells (mCherry−) by percentage of cells in G2/M phase in control, alms1 MO, ctrb1 mRNA, and alms1 MO plus ctrb1 mRNA injected animals at 48 hpf (n=3 experiments; each experiment represents n=50 embryos). All statistics, Ordinary one-way ANOVA, error bars represent standard error of the mean, symbols represent the following significance: NS=P>0.05, *=P<0.05, **=P<0.01, ****=P<0.0001.

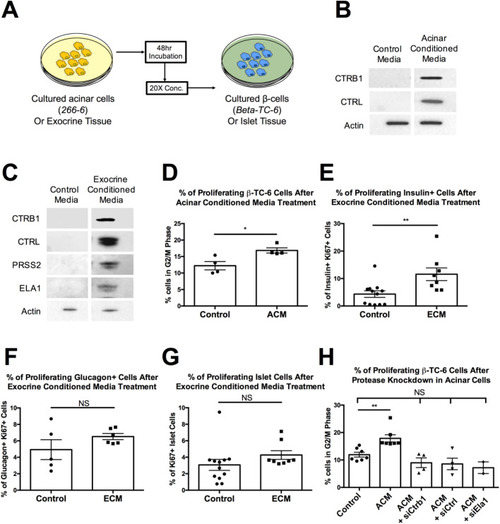
(A) Schematic of experimental design for assessing protease-β-cell interaction in cultured β-cells and islets. (B) Western blot of β-TC-6 lysate from cells treated with control media or acinar conditioned media (ACM) using anti-CTRB1 and anti-CTRL antibodies. (C) Western blot of islet tissue lysate from islets treated with control media or exocrine conditioned media (ECM) using anti-CTRB1, anti-CTRL, anti-PRSS2 and anti-ELA1 antibodies. (D) Quantification of proliferating β-TC-6 cells by percentage of cells in G2/M phase in control media or ACM treated cells. (E) Quantification of proliferating β-cells (insulin+) by percentage of Ki67 positive cells in control media or ECM treated islets. (F) Quantification of proliferating α-cells (glucagon+) by percentage of Ki67 positive cells in control media or ECM treated islets. (G) Quantification of proliferating islet cells by percentage of Ki67 positive cells in control media or ECM treated islets. (H) Quantification of proliferating β-TC-6 cells by percentage of cells in G2/M phase in control media, ACM, ACM lacking CTRB1 (ACM+siCtrb1), ACM lacking CTRL (ACM+siCtrl) and ACM lacking ELA1 (ACM+siEla1) treated cells. (**=P<0.01, Ordinary one-way ANOVA). Error bars represent standard error of the mean, symbols represent the following significance: NS=P>0.05, *=P<0.05, **=P<0.01, ***=P<0.001, Student's t-test unless otherwise indicated.

Endogenous chymotrypsinogen B1in β-cells. (A) Schematic of experimental design for generation of Tg(CTRB1-GFP),Tg(insa:mCherry) using CRISPR/Cas9 and homology directed repair for insertion of GFP at C-terminus of endogenous ctrb1 gene. (B) Brightfield image of Tg(CTRB1-GFP),Tg(insa:mCherry) animal at 5 dpf. (C) GFP fluorescence in Tg(CTRB1-GFP), Tg(insa:mCherry) animal at 5 dpf indicating successful fluorescence in Tg(CTRB1-GFP),Tg(insa:mCherry) animal at 5 dpf indicating successful fluorescence in Tg(CTRB1-GFP),Tg(insa:mCherry) animal at 5 dpf. (E) Quantification of colocalization of CTRB1 in zebrafish β-cells at 5 dpf by fold change in proportion of GFP+ mCherry+ cells in Tg(Ctrb1-GFP),Tg(insa:mCherry) compared with Tg(ptf1a:GFP),Tg(insa:mCherry). Error bars represent s.e.m. ***P<0.001, Student's t-test.

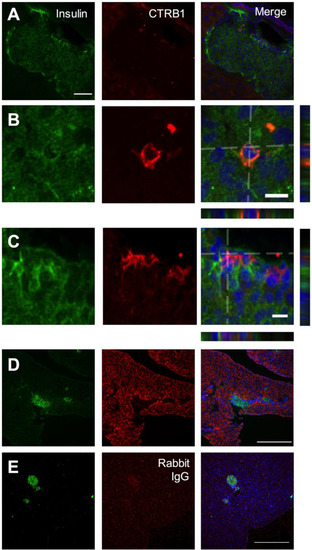
(A) High magnification islet view. Scale bar: 50 μm. (B,C) High magnification β-cell view. Merged image is a compressed Z-stack, orthogonal XZ and YZ are provided. Scale bars: 10 μm. (D,E) Low magnification pancreas stack, orthogonal XZ and YZ are provided. Scale bars: 10 μm. (D,E) Low magnification pancreas.

Acknowledgments
This image is the copyrighted work of the attributed author or publisher, and ZFIN has permission only to display this image to its users. Additional permissions should be obtained from the applicable author or publisher of the image. Full text @ Biol. Open