
Figure 4—figure supplement 3.
- ID
- ZDB-FIG-210630-61
- Publication
- Dehmelt et al., 2021 - Spherical arena reveals optokinetic response tuning to stimulus location, size, and frequency across entire visual field of larval zebrafish
- Other Figures
-
- Figure 1
- Figure 1—figure supplement 1.
- Figure 1—figure supplement 2.
- Figure 2
- Figure 2—figure supplement 1.
- Figure 2—figure supplement 2.
- Figure 3
- Figure 3—figure supplement 1.
- Figure 3—figure supplement 2.
- Figure 3—figure supplement 3.
- Figure 3—figure supplement 4.
- Figure 3—figure supplement 5.
- Figure 4
- Figure 4—figure supplement 1
- Figure 4—figure supplement 2.
- Figure 4—figure supplement 3.
- Figure 5
- Figure 5—figure supplement 1.
- Figure 5—figure supplement 2.
- Figure 5—figure supplement 3.
- Figure 6—figure supplement 1.
- Figure 6—figure supplement 1.
- All Figure Page
- Back to All Figure Page
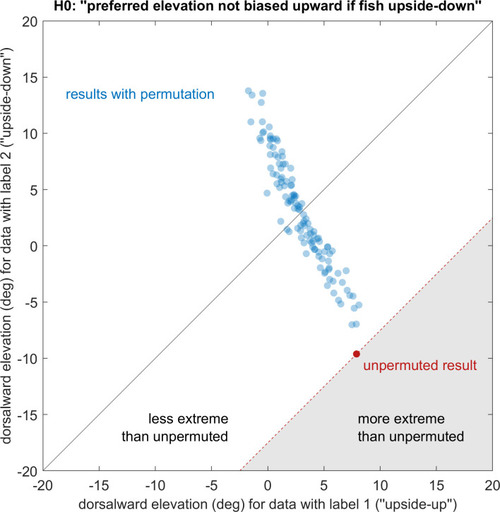
See Materials and methods for a detailed description of the permutation test. Showing the actual observation (red) and all 119 non-redundant permutations (blue) that maintain relative group size, p<0.05. ‘Dorsalward’ refers to the dorsal hemisphere in a body-centred reference frame, as opposed to the ‘upper’ hemisphere in an environmental reference frame. Before permutation, label one corresponds to the experiments shown in Figure 4a, whereas label two corresponds to those in Figure 4c. The test statistic is the signed distance from the black diagonal, with results in the white area being less extreme than those of the unpermuted observation. The null-hypothesis is rejected, so the elevation of OKR gain peaks within the visual field is not determined in body-centred coordinates, but instead biased towards upper elevations (‘towards the sun’, world-centred coordinates). |