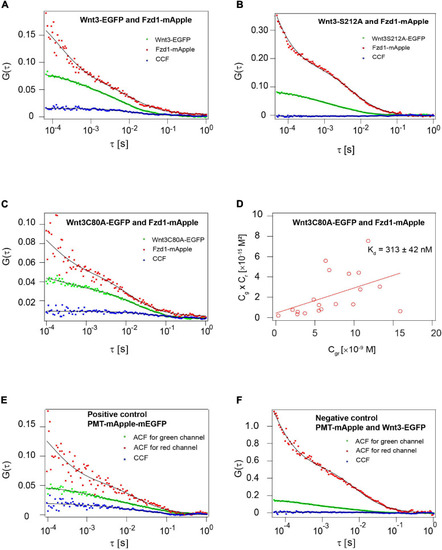
Influence of C80 and S212 lipidation on the interaction of Wnt3 with Fzd1 receptor. (A) Representative auto- and cross-correlation functions (dots) and fits (lines) of a Wnt3-EGFP and Fzd1mApple FCCS measurement. The positive cross-correlation function indicates Wnt3EGFP interacts with Fzd1mApple in vivo. (B) Representative auto- and cross-correlation functions (dots) and fits (lines) of a Wnt3S212A-EGFP and Fzd1mApple FCCS measurement. No cross-correlation function indicates Wnt3S212A-EGFP does not interact with Fzd1mApple in vivo. (C) Representative auto- and cross-correlation functions (dots) and fits (lines) of Wnt3C80A-EGFP and Fzd1mApple. The positive cross-correlation function indicates Wnt3C80-EGFP interacts with Fzd1mApple in vivo. (D) Determination of apparent dissociation constant (Kd) for Wnt3C80A-EGFP and Fzd1mApple interaction in vivo. Cg, Cr, and Cgr represents the concentration of unbound Wnt3C80A-EGFP, unbound Fzd1mApple, and bound Wnt3C80A-EGFP and Fzd1mApple molecules, respectively. The estimated apparent Kd (Kd = Cg×Cr/CrCgrCgr) for Wnt3C80A-EGFP and Fzd1mApple in vivo is 313 ± 42 nM. (E) Representative auto- and cross-correlation functions for PMT-mApple-mEGFP which is a positive control showing a clear cross-correlation. (F) Representative auto- and cross-correlation functions for embryos co-expressing PMT-mApple and PMT-mEGFP as a negative control.
|
