FIGURE SUMMARY
Title

Wnt3 Is Lipidated at Conserved Cysteine and Serine Residues in Zebrafish Neural Tissue

Authors
Dhasmana, D., Veerapathiran, S., Azbazdar, Y., Nelanuthala, A.V.S., Teh, C., Ozhan, G., Wohland, T.
Source
Full text @ Front Cell Dev Biol

Schematic for a SPIM-FCS experiment. (A) A stereomicroscope image of the dorsal region of a 2-3 dpf Wnt3-EGFP expressing embryo. (B) sCMOS camera image capturing a large field of view of Wnt3-EGFP expressing cells at the midbrain-anterior hind brain region. (C) EMCCD camera image of a smaller subregion expressing Wnt3-EGFP fluorescent cells. (D) Cropped detector region of the imaging area with only a single cell in view. (E) A summed-up intensity projection of the 100,000 frames imaging the apical membrane of the cell imaged in (D). (F) A 6 6 subregion’s slow component diffusion coefficient map obtained from the fit values of the ACFs. (G) The raw autocorrelation data in gray and their corresponding fits in red. (H) Diffusion law plot for the 6 6 region to obtain the τ0 intercept value.

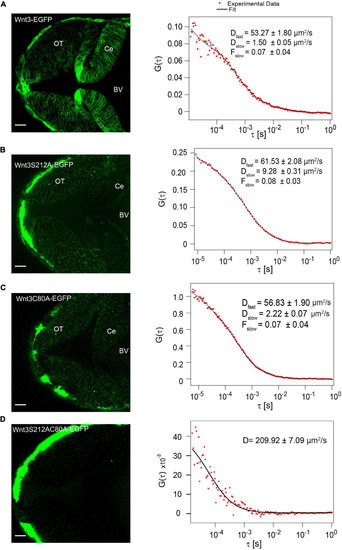
Influence of C80 and S212 lipidation on secretion in vivo. (A) Expression of Wnt3-EGFP in the zebrafish brain at ∼48 hpf (left) and a representative autocorrelation function (ACF; dots) and fit (line) of a Wnt3-EGFP FCS measurement in the BV (right). (B) Expression of Wnt3S212A-EGFP in the zebrafish brain at ∼48 hpf (left) and a representative autocorrelation function (ACF; dots) and fit (line) of Wnt3S212A-EGFP FCS measurement in BV (right). (C) Expression of Wnt3C80A-EGFP in the zebrafish brain at ∼48 hpf (left) and a representative autocorrelation function (ACF; dots) and fit (line) of a Wnt3C80A-EGFP FCS measurement in the BV (right). (D) Expression of Wnt3S212AC80A-EGFP in the zebrafish brain at ∼48 hpf (left) and a representative autocorrelation function (ACF; dots) and fit (line) of Wnt3S212AC80A-EGFP FCS measurement in BV (right). The FCS curves were fitted using 3D-2particle-1triplet model. BV, fourth brain ventricle; Ce, cerebellum; OT, optic tectum. Orientation: anterior to the left. Scale bar 20 μm.

Secretion of positive and negative control in the BV (A) Auto fluorescence signal from wild type (Wt) unlabeled zebrafish embryo and representative autocorrelation function (ACF; dots) and fit (line) of a FCS measurement in the BV at ∼48 hpf.). (B) Expression of sec-EGFP in the zebrafish brain at ∼48hpf (left) and a representative autocorrelation function (ACF; dots) and fit (line) of a FCS measurement in the BV (right). (C) Expression of PMT-mEGFP in the zebrafish brain at ∼48 hpf (left) and a representative autocorrelation function (ACF; dots) and fit (line) of a FCS measurement in the BV of zebrafish (right). The FCS curves were fitted using 3D-2particle-1triplet model. BV, fourth brain ventricle; Ce, cerebellum; OT, optic tectum. Orientation: anterior to the left. Scale bar 20 μm.

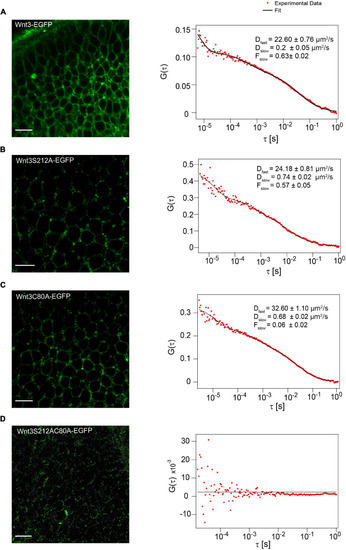
Influence of C80 and S212 lipidation on membrane localization in vivo. (A) Expression of Wnt3-EGFP on the cell membrane (left) and a representative autocorrelation function (ACF; dots) and fit (line) of a Wnt3-EGFP FCS measurement at a cell membrane (right). (B) Expression of Wnt3S212A-EGFP on the cell membrane (left) and a representative autocorrelation function (ACF; dots) and fit (line) of a Wnt3S212A-EGFP FCS measurement at a cell boundary (right). (C) Expression of Wnt3C80-EGFP on the cell membrane (left) and a representative autocorrelation function (ACF; dots) and fit (line) of a Wnt3C80A-EGFP FCS measurement at a cell membrane (right). (D) Expression of Wnt3S212AC80-EGFP on the cell membrane (left) (Image brightness was increased for clear visualization) and a representative autocorrelation function (ACF; dots) and fit (line) of a Wnt3S212AC80A-EGFP FCS measurement at a cell membrane (right). The FCS curves were fitted using 2D-2particle-1triplet model. BV, fourth brain ventricle; Ce, cerebellum; OT, optic tectum. Orientation: anterior to the left. Scale bar 10 μm.

Expression profile of the mutants co expressed with PMT-mApple. Co-expression of mutants (Wnt3C80A-EGFP, Wnt3S212A-EGFP, and Wnt3S212AC80A-EGFP) and PMT-mApple in the zebrafish brain at ∼48 hpf. PMT-mApple is a protein located on the inner leaflet of the cell membrane. It is expressed under a 4kb Wnt3 promoter and serves to mark the source cells of Wnt3 expression. (A) Expression profile of Wnt3C80A-EGFP co-expressed with PMT-mApple in zebrafish brain. (B) Expression of Wnt3C80A-EGFP co-expressed with PMT-mApple in the midbrain. (C) Expression profile of Wnt3S212A-EGFP co-expressed with PMT-mApple in zebrafish brain. (D) Expression of Wnt3S212A-EGFP co-expressed with PMT-mApple in the midbrain. (E) Expression profile of Wnt3C80AS212A-EGFP co-expressed with PMT-mApple in zebrafish brain. (F) Expression of Wnt3C80AS212A-EGFP co-expressed with PMT-mApple in the midbrain.

Membrane localization and dynamics of PMT-mEGFP Cell membrane localization of PMT-mEGFP (left) and a representative autocorrelation function (ACF; dots) and fit (line) of FCS measurement at the cell membrane (right). The FCS curves were fitted using 2D-2particle-1triplet model. Scale bar 10 μm.

Representative SPIM-FCS and Diffusion law data from a cell. (A) Autocorrelation functions (left) and Diffusion law plot (right) for a Wnt3-EGFP expressing cell in vivo. Wnt3-EGFP expressing cells have higher τ0 value than the mutants. (B) Autocorrelation functions (left) and Diffusion law plot (right) for a Wnt3C80A-EGFP mutant-expressing cell in vivo.(C) Autocorrelation functions (left) and Diffusion law plot (right) for a Wnt3S212-EGFP mutant expressing cell in vivo. All autocorrelation function plots have the raw correlation data in gray and their corresponding fit in red.

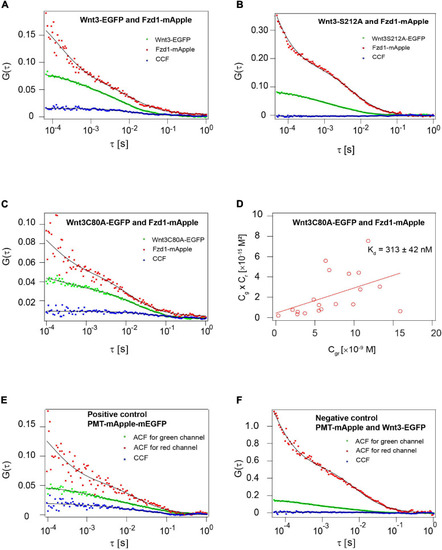
Influence of C80 and S212 lipidation on the interaction of Wnt3 with Fzd1 receptor. (A) Representative auto- and cross-correlation functions (dots) and fits (lines) of a Wnt3-EGFP and Fzd1mApple FCCS measurement. The positive cross-correlation function indicates Wnt3EGFP interacts with Fzd1mApple in vivo. (B) Representative auto- and cross-correlation functions (dots) and fits (lines) of a Wnt3S212A-EGFP and Fzd1mApple FCCS measurement. No cross-correlation function indicates Wnt3S212A-EGFP does not interact with Fzd1mApple in vivo. (C) Representative auto- and cross-correlation functions (dots) and fits (lines) of Wnt3C80A-EGFP and Fzd1mApple. The positive cross-correlation function indicates Wnt3C80-EGFP interacts with Fzd1mApple in vivo. (D) Determination of apparent dissociation constant (Kd) for Wnt3C80A-EGFP and Fzd1mApple interaction in vivo. Cg, Cr, and Cgr represents the concentration of unbound Wnt3C80A-EGFP, unbound Fzd1mApple, and bound Wnt3C80A-EGFP and Fzd1mApple molecules, respectively. The estimated apparent Kd (Kd = Cg×Cr/CrCgrCgr) for Wnt3C80A-EGFP and Fzd1mApple in vivo is 313 ± 42 nM. (E) Representative auto- and cross-correlation functions for PMT-mApple-mEGFP which is a positive control showing a clear cross-correlation. (F) Representative auto- and cross-correlation functions for embryos co-expressing PMT-mApple and PMT-mEGFP as a negative control.

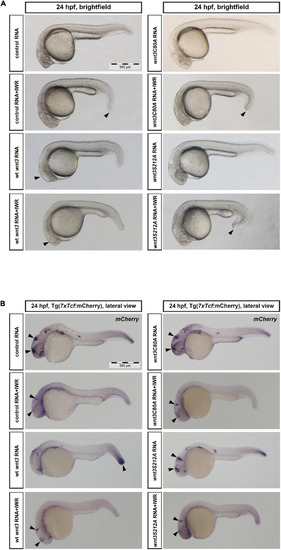
Influence of C80 and S212 residues on Wnt signaling activity (A) Morphological phenotypes at 24 hpf of embryos injected/treated with capped sense RNAs of control (EGFP 100 pg, 37/37 embryos), control +IWR (42/42 embryos, arrowhead: reduction in tail elongation), wt Wnt3 (100 pg, 47/53 embryos, arrowhead: loss of eye), Wnt3-EGFP + IWR (36/43 embryos, arrowhead: restoration of eye), Wnt3C80A-EGFP (100 pg, 41/43 embryos), Wnt3C80A-EGFP + IWR (41/44 embryos, arrowhead: reduction in tail elongation), Wnt3S212A-EGFP (100 pg, 52/54 embryos) or Wnt3S121A-EGFP + IWR (43/46 embryos, arrowhead: reduction in tail elongation). IWR was used at a concentration of 10 μM and DMSO was used in groups that were not treated with IWR. (B) Whole mount in situ hybridization (WMISH) in the transgenic Tg(7xTcf-Xla.Siam:nlsm-Cherryia) canonical Wnt/ß-catenin reporter embryos showing the effects of control (EGFP 100 pg, 33/33 embryos, arrowheads: anterior Wnt expression domains), control + IWR (45/45 embryos, arrowheads: reduction in anterior Wnt expression domains), Wnt3-EGFP (100 pg, 41/49 embryos, arrowheads: increase in posterior Wnt expression domain), Wnt3-EGFP + IWR (40/45 embryos, arrowheads: restoration of anterior Wnt expression domain), Wnt3C80A-EGFP (100 pg, 45/48 embryos, arrowheads: no effect on anterior Wnt expression domains), Wnt3C80A-EGFP + IWR (38/39 embryos, arrowheads: reduction in anterior Wnt expression domains), Wnt3S212A-EGFP (100 pg, 44/46 embryos, arrowheads: no effect on anterior Wnt expression domains) or Wnt3S121A-EGFP + IWR (50/53 embryos, arrowheads: reduction in anterior Wnt expression domains) on canonical Wnt signaling. IWR was used at a concentration of 10 μM and DMSO was used in groups that were not treated with IWR1. mCherry WMISH shows upregulation of signaling in Wnt/ß-catenin reporter embryos by Wnt3-EGFP but not by Wnt3C80A-EGFP or Wnt3S212A-EGFP.

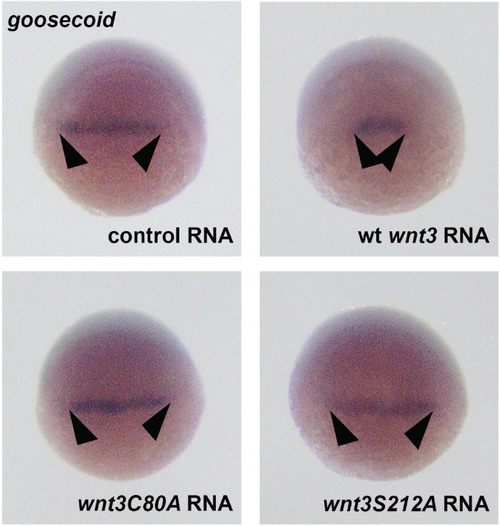
Whole mount in situ hybridization for the dorsal organizer marker gene goosecoid (gsc) in wt embryos at the shield stage, showing the effects of control (EGFP 100 pg, 35/35 embryos, arrowheads: normal gsc expression domain), Wnt3-EGFP (100 pg, 31/35 embryos, arrowheads: reduction in gsc expression domain), Wnt3C80A EGFP (100 pg, 38/41 embryos, arrowheads: no effect on gsc expression domain), and Wnt3S212A-EGFP (100 pg, 32/34 embryos, arrowheads: no effect on gsc expression domain).

Acknowledgments
This image is the copyrighted work of the attributed author or publisher, and ZFIN has permission only to display this image to its users. Additional permissions should be obtained from the applicable author or publisher of the image. Full text @ Front Cell Dev Biol