
Figure 4
- ID
- ZDB-FIG-210615-29
- Publication
- Kim et al., 2021 - TFEB Overexpression, Not mTOR Inhibition, Ameliorates RagCS75Y Cardiomyopathy
- Other Figures
- All Figure Page
- Back to All Figure Page
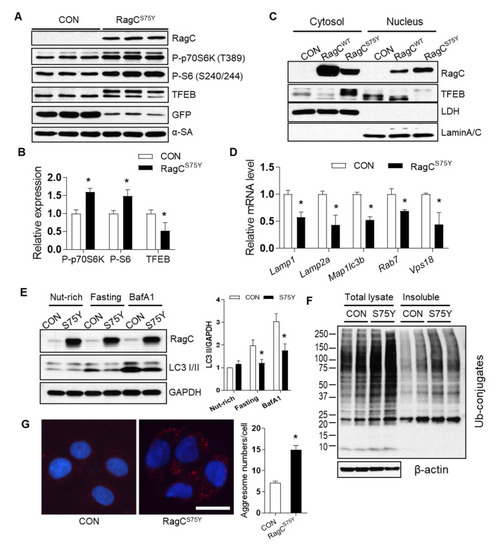
The mTORC1–TFEB-autophagy signaling was dysregulated in RagCS75Y cardiomyocytes. (A) Immunoblot of RagC, P-p70S6K (T389), P-S6 (S240/244), TFEB, GFP, α-SA in cell lysates of NRVCMs infected with Ad:GFP (CON, same as below) and Ad:RagCS75Y (RagCS75Y or S75Y, same as below). (B) Quantification of band intensity normalized by α-SA protein level, n = 3. (C) Representative immunoblot of RagC and TFEB proteins in the nuclear and cytosolic fractions of AD293 cells transfected with GFP and RagCS75Y. LDH and Lamin A/C were used as cytosolic and nuclear protein loading control, respectively. (D) The mRNA level of TFEB target genes in NRVCMs. The mRNA values were normalized to 18S rRNA and expressed as fold change over CON, n = 3–4. Lamp1, lysosomal-associated membrane protein 1; Lamp2a, lysosomal-associated membrane protein 2 alpha; Map1lc3b, microtubule-associated protein 1 light chain 3 beta; Rab7, RAB7, member RAS oncogene family; Vps18, VPS18 core subunit of CORVET and HOPS complexes. (E). Representative immunoblotting images of LC3 II flux in H9C2 cardiomyocytes infected with Ad:GFP (CON) and Ad:RagCS75Y (S75Y) cultured in nutrient rich (nut-rich), HBSS (Fasting, 1 h), and with Bafilomycin A1 (BafA1, 200 nmol/L, 2 h) conditions. (F). Total cell lysate and insoluble protein fractions of CON and S75Y cardiomyocytes were separated by SDS–PAGE and analyzed in immunoblots probed with antibodies against ubiquitin (Ub). β-actin was used as a loading control. (G). Representative image and quantification of aggresomes (red dots) stained by ProteoStat dye in CON and S75Y cardiomyocytes. Bar = 40 um, n > 100 in each group. All quantification data were shown as means ± SD (in C and D) or SEM (in E and G) and analyzed by Student’s t test. * p < 0.05 versus CON. |