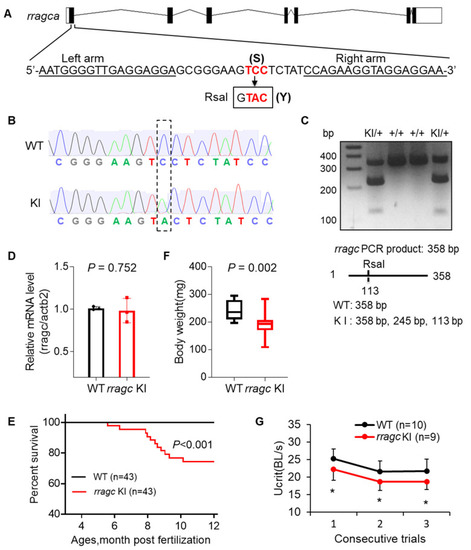
Generation of a zebrafish rragc S56Y knock-in mutant using TALEN. (A) Schematic diagram of rragca gene and the KI mutant. The left and right arm sequences of TALEN are underlined. The target sequence TCC (S) at residue 56 is changed to TAC (Y). Boxed is the newly created RsaI restriction enzyme recognition site. TALEN, transcription activator-like effector nucleases. (B) Shown are chromographs indicating the sequence change from WT to rragc S56Y KI homozygous. WT, wild type; KI, knock-in. (C) A representative genotyping gel to discern KI from WT allele. While WT allele will exhibit a 358 bp band, introduction of a new RsaI restriction site in KI results in a 245 bp and a 113 bp band. (D) RT-qPCR analysis of rragc transcript level in WT and rragc KI (homozygous, same in panel (E–G)) fish hearts. Data were normalized to actb2 and expressed as fold change over WT. (E) Kaplan–Meier survival curves for rragc KI fish and WT siblings by log-rank test. (F) Boxplots (MIN to MAX) illustrates reduced body weight of rragc KI fish at the age of 7 months. n = 10, 19. (G) Swimming capacity of rragc KI mutant compared with the WT siblings in 3 consecutive trials at 7 months. Ucrit, critical swimming speed. BL, body length. Data in (D) and (G) are expressed as mean ± SD, Student’s t test, * p < 0.05 versus WT.
|

