|
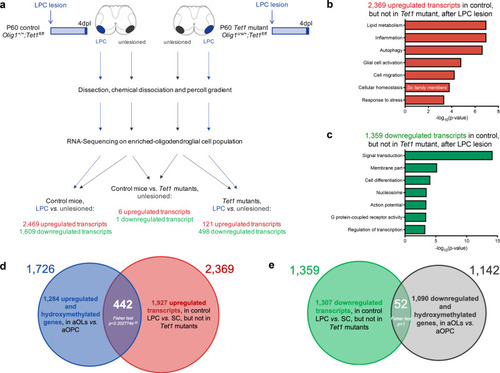
Identification of TET1-target genes during new myelin formation in adult CNS.a Schematic of the experimental design to identify TET1 target genes during myelin repair in young adult mice. Control (Olig1+/+;Tet1fl/fl) and Tet1 mutant (Olig1cre/+;Tet1fl/fl) mice were injected with lysolecithin. At 4 day-post-lesion (4dpl), the demyelinated region and contralateral unlesioned tissue were used for oligodendroglial enriched preparation followed by RNA-sequencing. Arrows identify the comparisons that were performed to identify differential gene expression among samples. Myelin repair in control mice was associated with 2469 up- (red) and 1609 down- (green) regulated genes in lesioned tissue compared to unlesioned. In Tet1 mutants, 121 transcripts were up- (red) and 498 down- (green) regulated. Unlesioned tissue of controls and Tet1 mutants showed a total of 7 genes as differentially expressed (6 up- and 1 downregulated). b Ontology categories of the 2369 genes that were upregulated during myelin repair only in control spinal cord, but not in Tet1 mutants. Corresponding GO numbers listed in order from top to bottom: GO:0044242, GO:0032675, GO:0006914, GO:0061900, GO:0030335, GO:0019725, GO:0006950. c Ontology categories of the 1359 genes that were downregulated during myelin repair only in control spinal cords, but not in Tet1 mutants. Corresponding GO numbers listed in order from top to bottom: GO:0007165, GO:0021515, GO:0001508, GO:0003257, GO:0008528, GO:0044459, GO:0000786. d Venn diagram comparing genes upregulated and with increased hydroxymethylation (at promoters and gene regions) in aOLs vs. aOPCs (blue circle) with genes upregulated in lesioned vs. unlesioned spinal cord in control but not in Tet1 mutants (red). Note the significant overlap (p = 2.202774e−33, Fisher test two-tailed), of 442 common genes with increased hydroxymethylation and expression levels in newly formed aOLs. e Venn diagram comparing genes downregulated and with increased hydroxymethylation (at promoters and gene regions) in aOLs vs. aOPCs (gray) with genes downregulated in lesioned vs. unlesioned spinal cord in control but not in Tet1 mutants (green). The overlap of 52 genes was not statistically significant (p = 1, Fisher test two-tailed).
|