FIGURE SUMMARY
Title

TET1-mediated DNA hydroxymethylation regulates adult remyelination in mice

Authors
Moyon, S., Frawley, R., Marechal, D., Huang, D., Marshall-Phelps, K.L.H., Kegel, L., Bøstrand, S.M.K., Sadowski, B., Jiang, Y.H., Lyons, D.A., Möbius, W., Casaccia, P.
Source
Full text @ Nat. Commun.

Age-dependent DNA hydroxymethylation during new myelin formation.

a Nuclear immunoreactivity specific for 5 methylated cytosine (5mC, green) and OLIG2 (red) in adult mouse spinal cord sections. Scale bar = 10 µm. b Bar graphs showing the relative proportion of OLIG2 + cells with low, medium, or high levels of 5mC immunoreactivity in the neonatal (P7) and adult (P60) spinal cord. Error bars represent SEM for n = 4 mice (*p < 0.05 and ***p < 0.001, two-way ANOVA, for age and 5mC immunoreactivity). c Nuclear immunoreactivity specific for hydroxymethylated cytosines (5hmC, green) and for OLIG2 (red) in adult mouse spinal cord sections. Scale bar = 10 µm. d Bar graphs showing the relative proportion of OLIG2 + cells with low, medium, or high levels of 5hmC immunoreactivity in the neonatal (P7) and adult (P60) spinal cord. Error bars represent SEM for n = 4 mice (**p < 0.01 and ***p < 0.001, two-way ANOVA, for age and 5hmC immunoreactivity). e Schematic experimental timeline of lysolecithin lesion experiment in young and old mice. f Electron micrographs of lesioned spinal cord sections from young (P60) and old (P540) mice at 21 days post-lesion (21dpl). Remyelination in young and old adult samples shown by white arrowheads. Scale bar = 5 µm. g Data indicate the average remyelinated axons in young and old spinal cord 21dpl. Error bars represent SEM for n = 5 young mice and n = 4 old mice (***p = 0.0002, Student’s t test two-tailed). h, i Quantification of the percentage of OLIG2 + cells with high levels of 5hmC in spinal cord lesions at 7dpl, 14dpl, and 21dpl, in young (h) and old (i) mice. Dotted line indicates the relative percentage of OLIG2 + cells with high level of 5hmC in unlesioned white matter tracts (NWM). Data represent the average of 3 sections/mouse. Error bars represent SEM for n = 5 young mice and n = 4 old mice (**p < 0.01 and ***p < 0.001, one-way ANOVA, for time after lesion). j, k Quantification of the percentage of CC1 + cells with high level of 5hmC in spinal cord lesions in young (j) and old (k) mice analyzed at 7dpl, 14dpl, and 21dpl. Dotted line indicates the relative percentage of CC1 + cells with high level of 5hmC in unlesioned white matter tracts (NWM). Data points indicate the average 3 sections/mouse. Error bars represent SEM for n = 5 young mice and n = 4 old mice (***p < 0.001, one-way ANOVA, time after lesion).

TET1 and TET2 are the most abundant isoforms in OLIG2 + cells in the adult spinal cord, with only TET1 displaying an age-dependent decline.

a, b Representative confocal images of coronal spinal cord (a) and brain (b) sections from adult mice (P60) stained with antibodies specific for the indicated TET isoforms (green) and for OLIG2 (in red). White arrowheads indicate co-labeled cells. Scale bar = 50 μm. c Percentage of OLIG2 + cells expressing TET1, TET2, or TET3 in postnatal P7 and adult P60 spinal cord. Error bars represent SEM for n = 4 (for neonates) and n = 22 (for adult) samples (***p < 0.001 for TET1, p = 0.0640 for TET2, p = 0.1281 for TET3, Student’s t test two-tailed). d Representative fluorescence-activated cell sorting plots of oligodendrocyte progenitor cells isolated from Pdgfrα-H2BEGFP reporter mice at neonatal (P5, nOPC), adult (P60, aOPC), and old (P540, oOPC) age. Single-cells were captured and RNA extracted using microfluidics (C1Fluidigm), coupled to RT-qPCR for single-cells, using Biomark. e Violin plots of Tet1 and Tet2 in nOPC (n = 61), aOPC (n = 76), and oOPC (n = 51) reveal a significant and sharp age-dependent decline of Tet1 and to a much lesser extent of Tet2 expression. Data represent log2 expression, derived from Ct (one-way ANOVA, factors age). f Bar graphs show the percentage of TET1 or TET2 expressing OLIG2+ cells in young and old spinal cord sections. Average counts in 3–4 sections per mouse for n = 22 (young) and n = 6 (old) mice, error bars represent SEM (***p < 0.001 for TET1, p = 0.5050 for TET2, Student’s t test two-tailed).

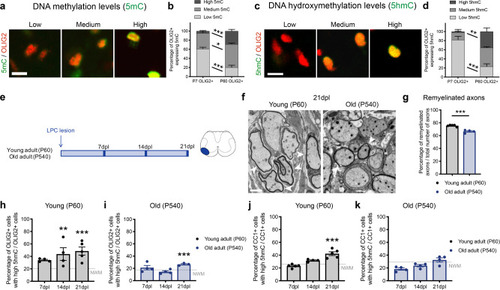
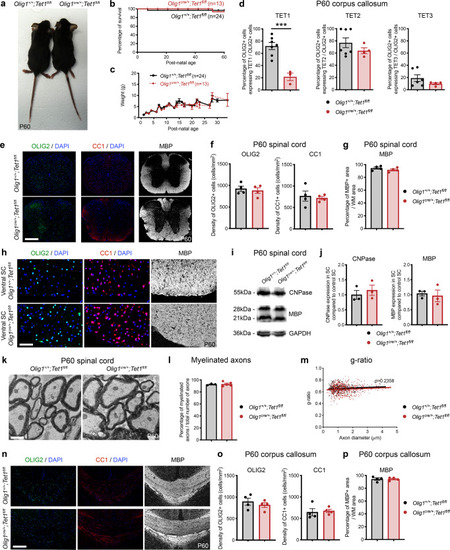
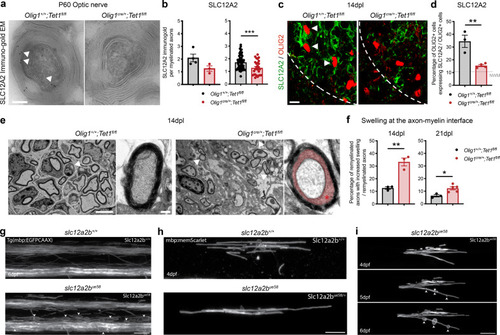
Ablation of <italic>Tet1</italic> during development is compatible with normal myelination in the adult central nervous system.

a Photograph of adult controls (Olig1+/+;Tet1fl/fl) and Tet1 mutant (Olig1cre/+;Tet1fl/fl) mice reveals no difference in body size. b Kaplan–Meier survival curve and c body weight for controls (n = 24) and Tet1 mutants (n = 13). Error bars represent SEM. d Percentage of TET1, TET2, and TET3 expressing OLIG2 cells in the corpus callosum of mice of the two genotypes. Note decreased percentage of OLIG2 + cells expressing TET1 without compensatory increase of TET2 or TET3 expressing cells. Error bars represent SEM for n = 7 control mice and n = 4 Tet1 mutants (***p = 0.0010 for TET1, p = 0.2801 for TET2, p = 0.2338 for TET3, Student’s t test two-tailed). e Representative P60 coronal sections of Olig1+/+;Tet1fl/fl and Olig1cre/+;Tet1fl/fl spinal cords, stained for OLIG2 (green), CC1 (red), MBP (white), DAPI (blue). Scale bars = 500 µm. f Quantification of OLIG2 + and CC1 + cell density (number of cells per mm2) in the spinal cord of mice of the indicated genotypes. Error bars represent SEM for n = 4 mice (p = 0.6482 for OLIG2, p = 0.7252 for CC1, Student’s t test two-tailed). g Average MBP + area relative to total white matter (WM) area in coronal spinal cord sections. Error bars represent SEM for n = 4 mice (p = 0.2693, Student’s t test two-tailed). h Representative confocal micrograph of adult ventral spinal cord in coronal sections from mice of the indicated genotype, stained for OLIG2 (green), CC1 (red), MBP (white), DAPI (blue). Scale bars = 100 µm. i Representative Western blot of protein extract from control and Tet1 mutants reveals similar levels of the myelin proteins CNPase, and MBP. GAPDH used as loading control. Molecular weight indicated on the left. j Average levels of the myelin proteins CNPase (left) and MBP (right), relative to GAPDH, quantified in three independent experiments. Error bars represent SEM for n = 3 spinal cords (p = 0.5347 for CNPase, p = 0.7295 for MBP, Student’s t test two-tailed). k Representative ultra-micrograph of adult ventral white matter spinal cords from mice of the indicated genotype revealing no difference in myelination between controls and mutants. Scale bar = 5 µm. l Percentage of myelinated axons relative to total axons in sections of P60 Olig1+/+;Tet1fl/fl and Olig1cre/+;Tet1fl/fl white matter spinal cords. Error bars represent SEM for n = 3 control mice and n = 5 Tet1 mutants (p = 0.8009, Student’s t test two-tailed). m Scatter plot of the g-ratio in myelinated axons of the indicated caliber, in adult control (black) and Tet1 mutant (red) spinal cords. A total of n = 116 axons in 3 control mice and n = 199 axons in 5 Tet1 mutants were quantified (non-linear regression, p = 0.2358, comparison of slopes with sum-of-squares F Test). n Representative confocal image of P60 coronal sections from Olig1+/+;Tet1fl/fl and Olig1cre/+;Tet1fl/fl corpus callosum, stained for OLIG2 (green), CC1 (red), MBP (white), DAPI (blue). Scale bar = 500 µm. o Quantification of OLIG2 + and CC1 + cell density (number of cells per mm2) in the corpus callosum of mice of the indicated genotypes. Error bars represent SEM for n = 4 mice (p = 0.4644 for OLIG2, p = 0.7750 for CC1, Student’s t test two-tailed). p Average MBP + area relative to total white matter (WM) area in corpus callosum. Error bars represent SEM for n = 4 mice (p = 0.9960, Student’s t test two-tailed).

Constitutive or inducible ablation of <italic>Tet1</italic> in OPC mimic the inefficient myelin repair detected in old mice.

a Experimental design in constitutive Tet1 or Tet2 knockout mice and controls. b, d Representative confocal image of spinal cord sections stained for 5hmC (green) and OLIG2 (red) at 14dpl in Tet1 (b) or Tet2 (d) mutant mice. White arrowheads indicate OLIG2 + cells with high levels of 5hmC immunoreactivity. Scale bar = 50 μm. c, e Percentage of OLIG2 + cells with high level of 5hmC in lesioned spinal cord sections at 14dpl in Tet1 (c) or Tet2 (e) mutants compared to that in wild-type mice. Dotted line indicates relative percentages in unlesioned white matter in the spinal cord (NWM). Average counts quantified in 3–4 sections/mouse for n = 3 control mice, n = 4 Tet1 mutants (c) and n = 5 for control and Tet2 mutants (e). Error bars represent SEM (**p = 0.0070 for (c), p = 0.8713 for (e), Student’s t test two-tailed). f, h Representative confocal images of spinal cord lesions stained for Fluoromyelin (green) at 14dpl in controls and Tet1 (f) or Tet2 (h) mutants (lesion area as white dashed line). Scale bar = 100 µm. g, i Fluoromyelin average intensity in control (gray bars) and Tet1 (red bar in g) or Tet2 (orange bar in i) lesions relative to the levels in unlesioned white matter (NWM) calculated for n = 3 control mice, n = 4 Tet1 mutants (g) and n = 5 for control and Tet2 mutants (i). Error bars represent SEM (***p = 0.0007 for g, p = 0.4304 for i, Student’s t test two-tailed). j Electron micrographs of remyelination (remyelinated axons indicated by white arrowheads) at 14dpl in Olig1+/+;Tet1fl/fl and Olig1cre/+;Tet1fl/fl spinal cords. Scale bar = 5 µm. k Percentage of remyelinated axons in controls (gray) and Tet1 mutants (red) at 14dpl, relative to total number of axons. Error bars represent SEM for n = 3 mice (*p = 0.0433, Student’s t test two-tailed). l Scatter plot of the g-ratio in myelinated axons of the indicated caliber in the lesioned spinal cord of wild-type mice (black) and Tet1 mutants (red) at 14dpl. A total of 107–150 axons were quantified for each mouse and n = 3 mice for each genotype were assessed (non-linear regression p = 0.501, comparison of slopes with sum-of-squares F Test). m Percentage of CC1 + cells with high level of 5hmC in lesioned spinal cord evaluated at 14dpl in mice of both genotypes. Dotted line indicates the percentage of CC1 + cells with high level of 5hmC in unlesioned tracts. Average counts from 3 quantified sections/mouse. Error bars represent SEM for n = 3 mice (*p = 0.0109, Student’s t test two-tailed). n Experimental design in inducible P60 Pdgfra-creER(T)+/+;Tet1fl/fl and Pdgfra-creER(T)Tg/+;Tet1fl/fl mice, after tamoxifen induction. o Percentage of OLIG2 + cells with high levels of 5hmC at 14dpl in Pdgfra-creER(T)+/+;Tet1fl/fl and Pdgfra-creER(T)Tg/+;Tet1fl/fl spinal cords, after tamoxifen induction. Dotted line indicates values in unlesioned tracts. Error bars represent SEM for n = 3 control mice and n = 5 inducible Tet1 mutants (***p = 0.0002, Student’s t test two-tailed). p Quantification of Fluoromyelin intensity in lesioned spinal cord at 14dpl, compared to normal white matter (NWM), in Pdgfra-creER(T)+/+;Tet1fl/fl and Pdgfra-creER(T)Tg/+;Tet1fl/fl after tamoxifen induction. Data represent the average intensity in lesioned compared to unlesioned areas. Error bars represent SEM for n = 3 control mice and n = 5 inducible Tet1 mutants (***p < 0.001, Student’s t test two-tailed).

DNA hydroxymethylation and gene expression in sorted adult oligodendrocyte progenitors and adult oligodendrocytes.

a Flow-activated cell-sorting of adult OPCs from Pdgfra-H2BEGFP and adult OLs from Plp-EGFP mice followed by RNA and DNA extraction and processing for RNA-Sequencing and RRHP DNA hydroxymethylation analysis. b Gene features distribution of differentially hydroxymethylated (DhMR) regions in aOLs relative to aOPCs. The bar graphs indicate the number of regions with increased (blue) or decreased (gray) hydroxymethylation at intergenic, enhancer, promoter, and gene regions. c Histograms of the overall distribution of hypo- (gray) and hyper- (blue) hydroxymethylated regions between aOLs and aOPCs samples. The bar graphs identify the number of DhMR at each level of decile DNA hydroxymethylation difference. d Ontology categories of the 5511 genes with increased hydroxymethylation, corresponding to the following GO, in decreasing order (from top to bottom: GO:0030154, GO:0010646, GO:0010628, GO:0050767, GO:0030334 (blue). e Only 72 genes showed decreased hydroxymethylation (gray), in aOLs compared to aOPCs, as defined by the RRHP analysis. f Gene ontology categories of the 1187 transcripts downregulated (green) in aOLs compared to aOPCs. From top to bottom, GO:0030334, GO:0042127, GO:0010646, GO:0050727, GO:0007155. g Gene ontology categories of the 1739 transcripts upregulated (red) in aOLs compared to aOPCs, as identified by RNA Sequencing analysis. From top to bottom, GO:0050794, GO:0019222, GO:0010468, GO:0051960, GO:0045595. h, i Quadrant plot of the relationship between genes with differential hydroxymethylation at promoters (h) or gene regions (i) and differential transcript (aOLs vs. aOPCs). The x axis indicates log2 fold change of transcript levels. The y axis refers to DNA hydroxymethylation differences. Note the “hot spot” (blue cloud of dots) identifying the abundance of genes with increased hydroxymethylation at promoters and gene regions associated with upregulated transcripts.

Identification of TET1-target genes during new myelin formation in adult CNS.

a Schematic of the experimental design to identify TET1 target genes during myelin repair in young adult mice. Control (Olig1+/+;Tet1fl/fl) and Tet1 mutant (Olig1cre/+;Tet1fl/fl) mice were injected with lysolecithin. At 4 day-post-lesion (4dpl), the demyelinated region and contralateral unlesioned tissue were used for oligodendroglial enriched preparation followed by RNA-sequencing. Arrows identify the comparisons that were performed to identify differential gene expression among samples. Myelin repair in control mice was associated with 2469 up- (red) and 1609 down- (green) regulated genes in lesioned tissue compared to unlesioned. In Tet1 mutants, 121 transcripts were up- (red) and 498 down- (green) regulated. Unlesioned tissue of controls and Tet1 mutants showed a total of 7 genes as differentially expressed (6 up- and 1 downregulated). b Ontology categories of the 2369 genes that were upregulated during myelin repair only in control spinal cord, but not in Tet1 mutants. Corresponding GO numbers listed in order from top to bottom: GO:0044242, GO:0032675, GO:0006914, GO:0061900, GO:0030335, GO:0019725, GO:0006950. c Ontology categories of the 1359 genes that were downregulated during myelin repair only in control spinal cords, but not in Tet1 mutants. Corresponding GO numbers listed in order from top to bottom: GO:0007165, GO:0021515, GO:0001508, GO:0003257, GO:0008528, GO:0044459, GO:0000786. d Venn diagram comparing genes upregulated and with increased hydroxymethylation (at promoters and gene regions) in aOLs vs. aOPCs (blue circle) with genes upregulated in lesioned vs. unlesioned spinal cord in control but not in Tet1 mutants (red). Note the significant overlap (p = 2.202774e−33, Fisher test two-tailed), of 442 common genes with increased hydroxymethylation and expression levels in newly formed aOLs. e Venn diagram comparing genes downregulated and with increased hydroxymethylation (at promoters and gene regions) in aOLs vs. aOPCs (gray) with genes downregulated in lesioned vs. unlesioned spinal cord in control but not in Tet1 mutants (green). The overlap of 52 genes was not statistically significant (p = 1, Fisher test two-tailed).

The protein encoded by the TET1-target gene Slc12a2 is localized at the axon–myelin interface.

a Representative images of cultured OPCs, transduced with the indicated lentiviral vectors and then stained for TET1 (green) and OLIG2 (red). White arrowheads indicate co-labeled cells. Scale bar = 25 µm. b Quantification of the percentage of OLIG2 + cells expressing TET1 in untransduced OPC and in cells transduced either with CTRL or hTET1-CD lentiviral vectors. Error bars represent SEM in n = 3 independent experiments (*p < 0.05, one-way ANOVA). c Quantitative real-time PCR analysis of Tet1 and Slc12a2 transcript levels in immunopanned OPCs after transfection with hTET1-CD lentivirus. Data represent average transcript levels relative to untransfected OPCs in n = 3 independent experiments. Error bars represent SEM (*p = 0.0232 for Tet1, *p = 0.0192 for Slc12a2, Student’s t test two-tailed). d Confocal image of mixed neuronal/glial cortical cultures. SLC12A2 (in green) is expressed by differentiating oligodendrocyte progenitors (co-stained with NG2, in red), and localized at contact points with axons (stained with NFM, in white). DAPI (blue) used as nuclear counterstain. White arrowheads indicate NFM + and NG2 + neuron-glial contact points co-labeled with SLC12A2. Scale bars = 50 µm and scale bars = 10 µm for high magnification images. e Immunogold staining for SLC12A2 on EM imaging in adult P75 WT optic nerves, showing the localization of SLC12A2 at the axon–myelin interface (white arrow-heads). Scale bar = 5 µm and scale bar = 1 µm for high magnification images. f Violin plots of Slc12a2 transcript levels in nOPC at P5 (n = 61 single cells), aOPC at P60 (n = 76 single cells), and oOPC at P540 (n = 51 single cells). Note the age-dependent decline of Slc12a2 transcripts (one-way ANOVA, for age). g Representative confocal image of young and old spinal cord sections, stained 14 days after lesion for SLC12A2 (green) and OLIG2 (red). The dotted white line indicates the lesion border. White arrowheads indicate co-labeled cells. Scale bar = 50 μm. h Quantification of in the percentage of OLIG2 + cells expressing also SLC12A2 in young and old lesioned spinal cords at 14dpl and 21dpl. Dotted gray line across indicates the percentage of OLIG2 + cells expressing SLC12A2 in unlesioned white matter tracts (NWM). Data represent average values quantified in 4 sections/mouse for n = 5 young and n = 4 old mice (*p < 0.05 and **p < 0.01, two-way ANOVA, for age and time after lesion). i Representative electron micrographs of young and old spinal cord sections at 21dpl, revealing increased swelling at the axo-myelinic interface (blue area and * asterisk). Scale bar = 10 µm. j Quantification of the percentage of remyelinated axons with swelling at the neuro-glial interface in young and old spinal cord lesions at 14dpl. Data represent the average values. Error bars represent SEM for n = 5 young and n = 4 old mice (***p = 0.0005, Student’s t test two-tailed).

Ablation of <italic>Slc12a2b</italic> in zebrafish induces myelin swellings reminiscent of those detected in old mice.

a Ultra-micrograph of immunogold staining for SLC12A2 in P60 Olig1+/+;Tet1fl/fl and Olig1cre/+;Tet1fl/fl optic nerves SLC12A2 immunoreactive particles localized at the axon–myelinic interface in control tissue(white arrowheads). Scale bar = 5 µm. b Quantification of the SLC12A2 particles in optic nerves. Data represent of the average number of SLC12A2 gold particles per mouse (left) and per axon (right). Error bars represent SEM for myelinated axons, quantified in n = 4 control and n = 3 mutant mice (total of at least 27 and at maximum 64 myelinated axons quantified in one replicate) (p = 0.0866, ***p = 0.0008, Student’s t test two-tailed). c Representative confocal image of spinal cord at 14dpl stained for SLC12A2 (green) andOLIG2 + (red), in mice of the indicated genotype. White arrowheads indicate co-labeled cells. Scale bar = 50 μm. d Percentage of OLIG2 + cells expressing SLC12A2 in lesioned spinal cords in mice of the two genotypes, at the 14dpl time point. Dotted line refers to the percentage of OLIG2 + cells expressing SLC12A2 in unlesioned tracts. Error bars represent SEM for n = 3 control mice and n = 4 Tet1 mutants (**p = 0.0059, Student’s t test two-tailed). e Representative electron micrographs of spinal cord sections from wild type and mutants at 14dpl. Low and high magnification (inset) are shown for Olig1+/+;Tet1fl/fl and Olig1cre/+;Tet1fl/fl. Note the swelling of the axomyelinic space in Tet1 mutants (red area and asterisk). Scale bar = 10 µm. f Quantification of the percentage of remyelinated axons with increased swelling in Olig1+/+;Tet1fl/fl and Olig1cre/+;Tet1fl/fl lesions at 14dpl and 21dpl. Data are average counts. Error bars represent SEM for n = 3 control mice and Tet1 mutants at 14dpl, n = 3 control mice and n = 5 Tet1 mutants at 21dpl (**p = 0.0032 at 14dpl, *p = 0.0164 at 21dpl, Student’s t test two-tailed). g Lateral views of the spinal cord in 6dpf Tg(mbp:EGFP-CAAX) zebrafish where myelinating glia in the CNS are labeled. Compared to wild-type sibling controls (left panel), larvae homozygous for the slc12a2bue58 mutation (right panel) show disrupted myelin morphology (white arrowheads). Scale bars = 20 µm. h Single mbp:mem Scarlet-expressing oligodendrocytes in wild-type (left panel) and slc12a2bue58 heterozygote siblings (right panel) at 4dpf. Scale bars = 20 µm. i Example time course showing the development of the myelin phenotype in single mbp:mem Scarlet-expressing oligodendrocytes in slc12a2bue58 homozygous mutants from 4 to 6dpf. White arrowheads point to localized areas of myelin disruption. Scale bar = 20 µm.

Acknowledgments
This image is the copyrighted work of the attributed author or publisher, and ZFIN has permission only to display this image to its users. Additional permissions should be obtained from the applicable author or publisher of the image. Full text @ Nat. Commun.