
Figure 6.3
- ID
- ZDB-FIG-210607-7
- Publication
- Okuda et al., 2021 - Live-imaging of endothelial Erk activity reveals dynamic and sequential signalling events during regenerative angiogenesis
- Other Figures
- All Figure Page
- Back to All Figure Page
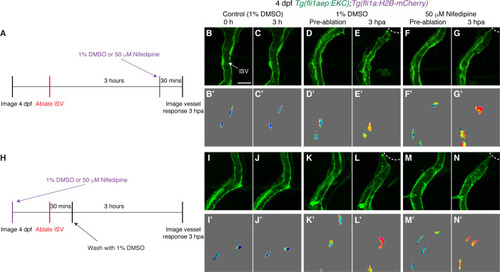
Ca2+ signalling is not required for sustained Erk activation in ablated ISV ECs. (A) Schematic representation of imaging schedule for larvae in images (B-G). (B–G’) Ca2+ signalling is not required for sustaining Erk activation in ablated ISV endothelial cells (ECs). Lateral spinning disc confocal images of ISV ECs in 4 days post-fertilisation (dpf) EC-EKC larvae treated with either 1% dimethyl sulfoxide (DMSO) (B–E’) or 50 μM Nifedipine (F–G’). Images (B-C’) show non-ablated control ISV ECs. Images (D) and (F) were taken pre-ablation and images (E) and (G) were taken 3 hours post-ablation (hpa). Images (B-G) show fli1aep:EKC expression, and images (B-G’) show the nuclear fli1aep:EKC intensity. (H) Schematic representation of imaging schedule for larvae in images (I-N). (I–N’) Lateral confocal images of ISV ECs in 4 dpf EC-EKC larvae treated with either 1% DMSO (I–L’) or 50 μM Nifedipine (M–N’). Images (I-J’) show non-ablated control ISV ECs. Images (K) and (M) were taken pre-ablation and images (L) and (N) were taken 3 hpa. Images (I-N) show fli1aep:EKC expression, and images (I-N’) show the nuclear fli1aep:EKC intensity. ISV: intersegmental vessel. White dotted lines show the wounded site of each larva. Scale bar: 15 μm. |