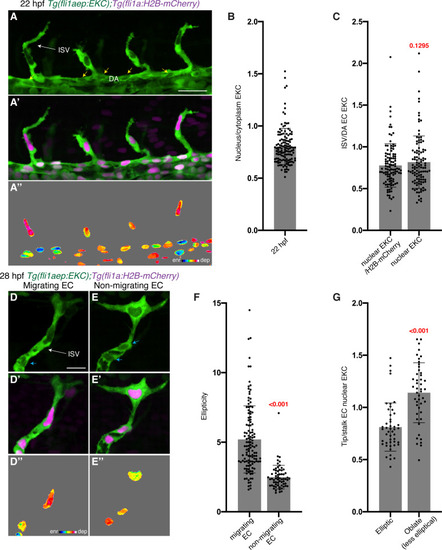
The EC-EKC transgenic line reports tip-cell-enriched and cell-state-dependent Erk-signalling during primary angiogenesis.
(A–A’’) Lateral spinning disc confocal images of budding ISVs in a 22 hours post-fertilisation (hpf) EC-EKC embryo show high Erk activity in ISV tip endothelial cells (ECs). Image (A) shows fli1aep:EKC expression, image (A’) shows both fli1aep:EKC and fli1a:H2B-mCherry expression, while image (A’’) shows the nuclear fli1aep:EKC expression intensity. Yellow arrows point to DA ECs with nuclear depleted EKC localisation. (B) Quantification of the nucleus/cytoplasm EKC intensity ratio in sprouting ISV tip ECs of 22 hpf embryos (0.803, 133 ECs, n = 37 embryos) showing consistently higher levels in cytoplasm. (C) Quantification of the sprouting ISV tip EC/DA stalk EC nuclear EKC intensity ratio with two different methods in 22 hpf embryos (109 ECs, n = 37 embryos). DA ECs closest to the sprouting ISV ECs were quantified. Ratios were calculated using a value of nuclear EKC/H2B-mCherry intensity in tip cells (0.777) or using a raw nuclear EKC intensity measurement alone in tip cells (0.817), both showed higher Erk activity in sprouting ISV tip ECs when compared to DA stalk ECs. (D–E’’) Nuclear ellipticity and Erk activity correlate. Lateral spinning disc confocal images of either an ISV with ‘migrating EC’ (D) or an ISV with ‘non-migrating EC’ (E) in 28 hpf EC-EKC embryos. Migrating or non-migrating determined by position relative to the dorsal longitudinal anastomotic vessel (DLAV) (D and E) fli1aep:EKC expression; (D’ and E’) fli1aep:EKC and fli1a:H2B-mCherry; (D’’ and E’’) nuclear fli1aep:EKC expression intensity. Light blue arrow shows ISV stalk ECs with nuclear depleted EKC localisation. (F) Quantification of EC ellipticity in ‘migrating’ (125 ECs, n = 45 embryos) and ‘non-migrating’ ISV leading ECs based on position relative to DLLV (63 ECs, n = 35 embryos) at 28 hpf. (G) More migratory ECs, with more elliptical nuclei, show higher Erk activity. Quantification of tip/stalk ISV EC nuclear EKC intensity for the most elliptic (47 ECs, n = 30 embryos) or less elliptic (oblate) nuclei (47 ECs, n = 29 embryos) in 28 hpf embryos. Most elliptic (upper quartile of all migrating ECs in F) and oblate (lower quartile of all non-migrating ECs in F) nuclei were quantified. ISV: intersegmental vessel; DA: dorsal aorta. Statistical test: Mann-Whitney test was conducted for graphs (C), (F), and (G). Error bars represent standard deviation. Scale bars: 25 μm for image (A), 15 μm for image (D).
EKC measurements in ISV ECs at 22 and 28 hpf.
Expression Data
Expression Detail
Antibody Labeling
Phenotype Data
Phenotype Detail
Acknowledgments
This image is the copyrighted work of the attributed author or publisher, and
ZFIN has permission only to display this image to its users.
Additional permissions should be obtained from the applicable author or publisher of the image.
Full text @ Elife
Your Input Welcome
Thank you for submitting comments. Your input has been emailed to ZFIN curators who may contact you if
additional information is required.
Oops. Something went wrong. Please try again later.