|
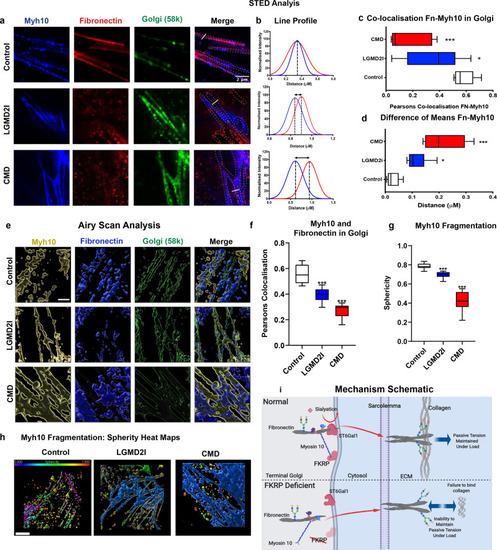
The relative localisation of fibronectin and myosin10 is altered in the Golgi of FKRP-deficient cells.Fibronectin and myosin10 protein localisation within the trans-Golgi, as determined by STED microscopy and Gaussian distribution line profile analyses, images representative of a minimum of three repeats separated by a minimum of a week and three technical repeats. a STED images of myosin10: blue, fibronectin: red and Golgi 58 k protein: green. Merged image marked for Golgi with dashed lines and white solid lines marking the location of the line profiles quantitated in b. b Individual line profiles, normalised to maximum and using Gaussian distribution curve in Fiji image analysis software, fibronectin red, myosin10 blue, means marked with dotted lines. c Co-localisation of myosin10 and fibronectin from the Golgi identified by a 58 K antibody stain, Pearson correlation analysis (*P < 0.05), (***P < 0.0001) (n = 9), box-and-whisker plot, middle line = mean, box = 95% confidence interval, error bars = SEM, one-way ANOVA analysis. d Quantitation of the difference between individual line profile means, analysed from Gaussian fit curves in b (n = 9), (*P < 0.05), (***P < 0.0001). Box-and-whisker plot, middle line = mean, box = 95% confidence interval, error bars = SEM. e–h Analysis of Airyscan data in Imaris image analysis software. e Images from the Airyscan rendered in 3D, myosin10 in yellow, fibronectin in blue and Golgi: Golgi Reassembly Stacking Protein 2 (GORASP2) in green, scale bar = 2 µm. f Pearson’s correlation of fibronectin and myosin10 using Golgi marker: GORASP2 was used as a mask for analysis. Box-and-whisker plots, error bars represent a 95% confidence interval and middle box line represents mean (***P < 0.0001). One-way ANOVA analysis (n = 9 for each sample), one-way ANOVA analysis. g Sphericity of fibronectin within Golgi, Imaris generated surfaces and software analysis. Box-and-whisker plots, error bars represent a 95% confidence interval and middle box line represents mean (***P < 0.0001). One-way ANOVA analysis (n = 9 for each sample). h Airyscan data with cells rendered in 3D and statistically coded for sphericity in a heat map (with a value of one (red) indicating a perfect sphere) reveal the altered Golgi structure in patient cells, scale bar 2 µm. i Schematic of FKRP action. The schematic illustrates that in healthy control cells, FKRP is required to correctly localise myosin10 within the terminal Golgi, a process important for sialylation of fibronectin, that in turn regulates its binding to collagen. In FKRP deficiency, myosin10 is no longer anchored correctly and fibronectin is consequently not sialylated correctly. This lack of sialylation results in a failure of collagen–fibronectin binding at the MBM, which ultimately leads to a loss of MBM stability and an inability of individual muscle fibres to resist passive force.
|