|
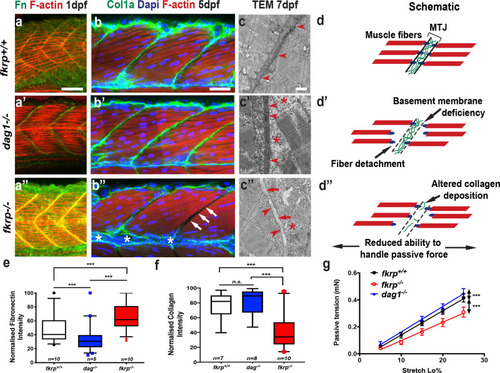
The fibronectin–collagen axis is disrupted at the muscle basement membrane in <italic>fkrp</italic> mutants.a–b” Fibronectin and collagen immunochemistry. Whole-mount staining and confocal imaging of zebrafish myotomes centred on myotome 10 (1 dpf) and myotome 12 (5 dpf). Images are z projections of the mediolateral extent of the myotome stained for f-actin (red) to mark muscle fibres and DAPI (blue) for nuclei. a Fibronectin (Fn) staining (green) at the vertical myosepta at 1 dpf, images representative of n = 9, three larvae from three separate clutches on different weeks, most severe and weakest phenotypes excluded (scale bar = 30 μm). a’dag1−/−, a”fkrp−/−. b Collagen-1 (Col1a, green) staining of the muscle basement membrane in wild-type sibling fish. b’dag1−/− and b”fkrp−/−, white arrow: absent collagen, scale bar = 40 μm. a–b” Lateral views anterior to the left. c Transmission electron micrographs (TEM) of longitudinal sections of 7 dpf zebrafish myotome centred on the muscle basement membrane (red arrowheads). Red arrows: absent collagen fibrils, red star: fibre detachment from vertical myosepta, scale bar = 0.5 μm. Wild-type siblings, c’, dag1−/−c”, fkrp−/−, micrographs representative of (n = 9), three larvae from three separate clutches on different weeks, most severe and weakest phenotypes excluded. d Schematic of fibre-crossing and detachment model at the Myotendinous Junction (MTJ) and disease progression, d’ canonical DGC axis in dag1−/− and, d” combined detachment crossing in fkrp−/−. e, f Measurement of max intensity from fibronectin (e) and collagen (f) staining analysed by two-way ANOVA, ***(P = <0.0001), plotted points outside 95% confidence interval, box represents 5–95%, median centre line, whiskers = SEM, Tukey’s multiple comparison analysis, three independent experiments. g Passive force measurement at 6 dpf, calculated by plotting the maximum active force at given loads, as passive tension (mN) against external stretch (Lo%), with representative linear regression analysis of the plotted points of fkrp+/+ sibling (sib); black line (n = 8), fkrp−/−, red line (n = 6) and dag1−/− blue line (n = 5) was used to test the significance of the differences (***P = <0.0001), error bars = SEM.
|