Fig. 3
- ID
- ZDB-FIG-210520-61
- Publication
- Wang et al., 2021 - Eukaryotic initiation factor 4A3 inhibits Wnt/β-catenin signaling and regulates axis formation in zebrafish embryos
- Other Figures
- All Figure Page
- Back to All Figure Page
|
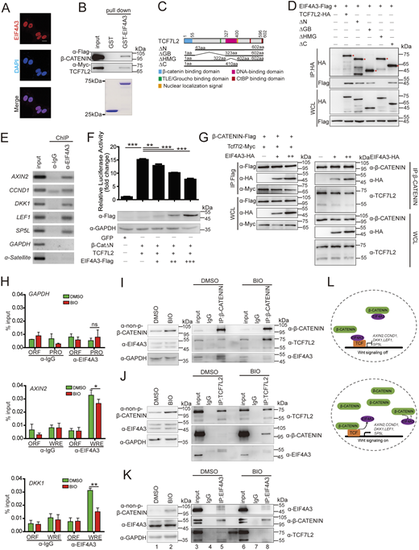
(A) Overexpression of EIF4A3/eif4a3 ventralizes zebrafish embryos. Classification of phenotypes at 24 hpf caused by the forced expression of EIF4A3/eif4a3 mRNA. (B) Percentage of embryos in each category shown in A. The embryos were injected with 400 pg (+) and 800 pg (++) of eif4a3 mRNA, and some also received 800 pg of EIF4A3 mRNA (bottom graph). (C-F) Expression domains of otx2 (C) and gata1 (E) markers at indicated stages. Dorsal is downwards in C. (D,F) Percentage of embryos in each category shown in C and E. (G) Overexpression of eif4a3 reduced the expression of indicated dorsal markers at 4.3 hpf. Embryos injected with 800 pg of gfp or eif4a3 mRNA were raised to 4.3 hpf and then subjected to whole-mount in situ hybridization analysis with the indicated markers. Arrows indicate the edges of the mRNA expression domains. (H) Quantification of the arc of marker expression shown in G. (I) Expression patterns of chd and gsc marker genes in zebrafish embryos injected with 800 pg of indicated mRNAs at 4.3 hpf. (J) Quantification of the arc of marker expression shown in I. (K) EIF4A3 mutants exhibit inhibition of β-CatΔN activity in vivo. Expression patterns of chd and gsc marker genes in zebrafish embryos injected with 850 pg gfp or 50 pg β-catΔN plus 800 pg of each indicated mRNA at 4.3 hpf. Red arrow indicates the ectopic expression of chd and gsc on the ventral side. (L) Quantification of the arc of marker expression shown in K. (M) EIF4A3 mutants exhibit the inhibition on β-CatΔN activity in vitro. The indicated plasmid DNA was co-transfected with TOPFlash plasmid DNA into HCT116 cells and the luciferase activity was measured (n=3-6). The above results are from three independent experiments. The frequency of embryos with the indicated phenotypes is shown in the bottom right corner of each panel or the total embryo numbers are given at the top. All embryos are top views with dorsal towards the right, and dorsal views with animal pole upwards. Data are mean±s.e.m. ***P<0.001. Unpaired t-test, two-tailed. Groups labeled with different letters are significantly different from each other. Lowercase letter, P<0.05; uppercase letter, P<0.01. One-way ANOVA followed by Tukey's post-hoc test. Scale bars: 200 μm. |

