
- Title
-
Eukaryotic initiation factor 4A3 inhibits Wnt/β-catenin signaling and regulates axis formation in zebrafish embryos
- Authors
- Wang, B., Rong, X., Zhou, Y., Liu, Y., Sun, J., Zhao, B., Deng, B., Lu, L., Lu, L., Li, Y., Zhou, J.
- Source
- Full text @ Development
(A) EIF4A3/Eif4a3 interacts with β-catenin, as indicated by co-immunoprecipitation. Upper panel: exogenous EIF4A3 interacts with β-catenin. Middle panel: endogenous β-catenin and EIF4A3 interact with each other in HEK293T cells. Lower panel: endogenous β-catenin and Eif4a3 interact with each other in zebrafish embryos at 24 hpf. (B,C) Determination of the region of EIF4A3 required for its interaction with β-catenin. Schematic diagram of human EIF4A3 protein domains are shown in B. Various Flag-tagged EIF4A3 mutants were co-expressed with Myc-tagged β-catenin in HEK293T cells and cell lysates were subjected to co-immunoprecipitation (C). (D,E) Determination of the region of β-catenin required for the EIF4A3 interaction. Schematic diagram of human β-catenin protein domains is shown in D. Various Myc-tagged β-catenin truncations were co-expressed with Flag-tagged EIF4A3 in HEK293T cells and cell lysates were subjected to co-immunoprecipitation (E). |

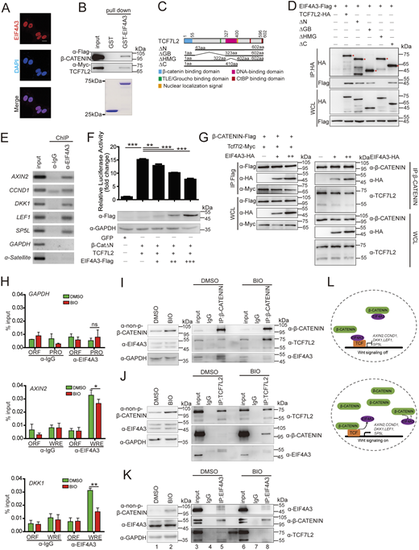
(A) Localization of EIF4A3 in HeLa cells, visualized by immunofluorescence (red) with an anti-EIF4A3 antibody. Nuclei (blue) were counterstained with DAPI. Scale bar: 20 μm. (B) EIF4A3 directly binds to β-catenin and TCF7L2. (C,D) Mapping of the region in the TCF7L2 responsible for the EIF4A3 interaction. Schematic diagram of human TCF7L2 protein domains is shown in C. Various HA-tagged TCF7L2 deletion mutants were co-expressed with Flag-tagged EIF4A3 in HEK293T cells and cell lysates were subjected to co-immunoprecipitation (D). Asterisks indicate specific bands. (E) Endogenous EIF4A3 is associated with the promoters of the indicated Wnt target genes in HEK293T cells, as indicated by the ChIP assay. The promoters of GAPDH and α-Satellite were used as negative controls. (F) EIF4A3 represses β-catenin/TCF7L2-mediated transcriptional activity. (G) EIF4A3 impairs the interaction between β-catenin and TCF7L2. Left panel: HCT116 cells were co-transfected with tagged β-catenin and TCF7L2 along with various doses of EIF4A3. Right panel: EIF4A3 at various doses was transfected into HCT116 cells. Proteins were extracted from cell lysates, immunoprecipitated and subjected to a western blot analysis using the indicated antibodies. (H) BIO treatment releases EIF4A3 from the indicated Wnt target genes in HEK293T cells, as indicated by ChIP assay. HEK293T cells were treated with DMSO or 1 μM BIO for 4 h and then cells were harvested for the ChIP assay. The promoter of GAPDH was used as a negative control. WRE, Wnt response element; ORF, open reading frame; PRO, promoter region. (I-K) BIO treatment decreases the EIF4A3 levels in the β-catenin and TCF7L2 immunoprecipitant, and a similar effect is seen on β-catenin and TCF7L2 levels in the EIF4A3 immunoprecipitant. HEK293T cells were treated with DMSO or 1 μM BIO for 4 h; cells were then harvested and proteins were extracted from cell lysates, immunoprecipitated and subjected to a western blot analysis using the indicated antibodies to determine the interaction among EIF4A3, β-catenin and TCF7L2 under different Wnt activity. (L) Working model for the role of EIF4A3 involved in the β-catenin/TCF complex. Data are mean±s.e.m. (n=3). *P<0.05; **P<0.01; ***P<0.001, ns, not significant. Unpaired t-test, two-tailed. |
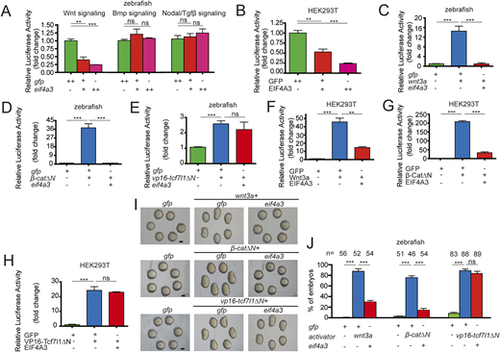
(A) Overexpression of EIF4A3/eif4a3 ventralizes zebrafish embryos. Classification of phenotypes at 24 hpf caused by the forced expression of EIF4A3/eif4a3 mRNA. (B) Percentage of embryos in each category shown in A. The embryos were injected with 400 pg (+) and 800 pg (++) of eif4a3 mRNA, and some also received 800 pg of EIF4A3 mRNA (bottom graph). (C-F) Expression domains of otx2 (C) and gata1 (E) markers at indicated stages. Dorsal is downwards in C. (D,F) Percentage of embryos in each category shown in C and E. (G) Overexpression of eif4a3 reduced the expression of indicated dorsal markers at 4.3 hpf. Embryos injected with 800 pg of gfp or eif4a3 mRNA were raised to 4.3 hpf and then subjected to whole-mount in situ hybridization analysis with the indicated markers. Arrows indicate the edges of the mRNA expression domains. (H) Quantification of the arc of marker expression shown in G. (I) Expression patterns of chd and gsc marker genes in zebrafish embryos injected with 800 pg of indicated mRNAs at 4.3 hpf. (J) Quantification of the arc of marker expression shown in I. (K) EIF4A3 mutants exhibit inhibition of β-CatΔN activity in vivo. Expression patterns of chd and gsc marker genes in zebrafish embryos injected with 850 pg gfp or 50 pg β-catΔN plus 800 pg of each indicated mRNA at 4.3 hpf. Red arrow indicates the ectopic expression of chd and gsc on the ventral side. (L) Quantification of the arc of marker expression shown in K. (M) EIF4A3 mutants exhibit the inhibition on β-CatΔN activity in vitro. The indicated plasmid DNA was co-transfected with TOPFlash plasmid DNA into HCT116 cells and the luciferase activity was measured (n=3-6). The above results are from three independent experiments. The frequency of embryos with the indicated phenotypes is shown in the bottom right corner of each panel or the total embryo numbers are given at the top. All embryos are top views with dorsal towards the right, and dorsal views with animal pole upwards. Data are mean±s.e.m. ***P<0.001. Unpaired t-test, two-tailed. Groups labeled with different letters are significantly different from each other. Lowercase letter, P<0.05; uppercase letter, P<0.01. One-way ANOVA followed by Tukey's post-hoc test. Scale bars: 200 μm. |

(A) Representative views of siblings and eif4a3 mutants with a p53 mutant background at 24 hpf. (B,C) Expression of the indicated markers gata1 and rx1 in siblings and eif4a3 mutants with the p53−/− background at 24 hpf. (D) Expression of the indicated dorsoventral markers in siblings and eif4a3 mutants with the p53−/− background at 6 hpf. (E) Quantification of the arc of marker expression shown in D. (F) Expression of the indicated anteroposterior neural markers in siblings and eif4a3 mutants with the p53−/− background at 12.5 hpf. Lateral views with the dorsal side to the right and animal pole upwards. (G) Expression of cdx4 and sp5l in eif4a3 mutants and siblings with the p53−/− background at 80% epiboly stage. Arrowheads indicate the edges of the indicated mRNA expression domains. Lateral views with the dorsal side to the right and animal pole upwards. (H) Depletion of eif4a3 with the p53−/− background elevates the expression of the indicated Wnt direct target genes at 80% epiboly stage, as indicated by qRT-PCR analysis. Embryos are from three pairs of adult fish. Embryos were raised to each indicated stage, subjected to the whole-mount in situ hybridization analysis, photographed and then genotyped in A-G. Each embryo was genotyped and subjected to qRT-PCR in H. Data are mean±s.e.m. *P<0.05; **P<0.01; ***P<0.001. Unpaired t-test, two-tailed. Scale bars: 200 μm. |

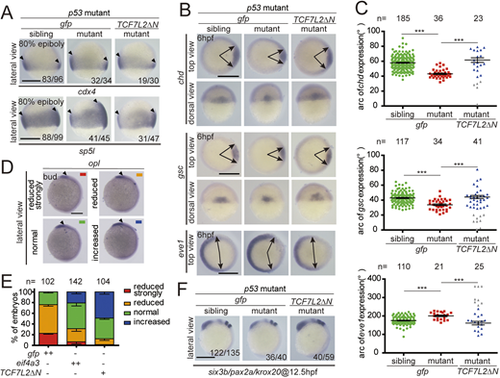
Zygotic eif4a3 mutant embryos exhibit ventralized phenotypes and increases in Wnt activity. (A) Representative views of siblings and eif4a3 mutants with a p53 mutant background at 24 hpf. (B,C) Expression of the indicated markers gata1 and rx1 in siblings and eif4a3 mutants with the p53−/− background at 24 hpf. (D) Expression of the indicated dorsoventral markers in siblings and eif4a3 mutants with the p53−/− background at 6 hpf. (E) Quantification of the arc of marker expression shown in D. (F) Expression of the indicated anteroposterior neural markers in siblings and eif4a3 mutants with the p53−/− background at 12.5 hpf. Lateral views with the dorsal side to the right and animal pole upwards. (G) Expression of cdx4 and sp5l in eif4a3 mutants and siblings with the p53−/− background at 80% epiboly stage. Arrowheads indicate the edges of the indicated mRNA expression domains. Lateral views with the dorsal side to the right and animal pole upwards. (H) Depletion of eif4a3 with the p53−/− background elevates the expression of the indicated Wnt direct target genes at 80% epiboly stage, as indicated by qRT-PCR analysis. Embryos are from three pairs of adult fish. Embryos were raised to each indicated stage, subjected to the whole-mount in situ hybridization analysis, photographed and then genotyped in A-G. Each embryo was genotyped and subjected to qRT-PCR in H. Data are mean±s.e.m. *P<0.05; **P<0.01; ***P<0.001. Unpaired t-test, two-tailed. Scale bars: 200 μm. |
(A) Expression areas of Wnt targets in indicated groups of embryos at 80% epiboly stage. (B) Expression of the dorsoventral markers in indicated groups at 6 hpf. (C) Quantification of the arc of marker expression shown in B. A small number of mutant embryos within the TCF7L2ΔN mRNA injected groups showed more severe phenotypes in comparison with those of mutant embryos injected with gfp mRNA (gray data points). (D,E) Eif4a3 and TCF7L2ΔN rescue forebrain defects in apc mutants. Representative expression domain of the anterior neural marker, opl, in each indicated class of embryos at the bud stage (D) and quantification of each indicated class (E). One-cell stage embryos of apc+/−×apc+/− were injected with 200 pg of gfp or eif4a3 mRNA, or 50 pg of TCF7L2ΔN mRNA, raised to the bud stage and subjected to whole-mount in situ hybridization analysis. Each embryo was photographed and then genotyped. (F) Expression of anteroposterior neural markers in each indicated group of embryos at 12.5 hpf. One-cell stage embryos were injected with 50 pg of gfp or TCF7L2ΔN mRNA, raised to the indicated stage and subjected to whole-mount in situ hybridization analysis. Each embryo was photographed and then genotyped. All embryos are lateral views with dorsal to the right and anterior upwards, top views with dorsal to the right, and dorsal views with animal pole upwards. Embryos are examples from three pairs of adult fishes. Data are mean±s.e.m. ***P<0.001. Unpaired t-test, two-tailed. Scale bars: 200 μm. |
|
ZFIN is incorporating published figure images and captions as part of an ongoing project. Figures from some publications have not yet been curated, or are not available for display because of copyright restrictions. PHENOTYPE:
|
|
ZFIN is incorporating published figure images and captions as part of an ongoing project. Figures from some publications have not yet been curated, or are not available for display because of copyright restrictions. PHENOTYPE:
|