
Figure 5
- ID
- ZDB-FIG-210518-39
- Publication
- Wu et al., 2021 - Automatic wavelet-based 3D nuclei segmentation and analysis for multicellular embryo quantification
- Other Figures
- All Figure Page
- Back to All Figure Page
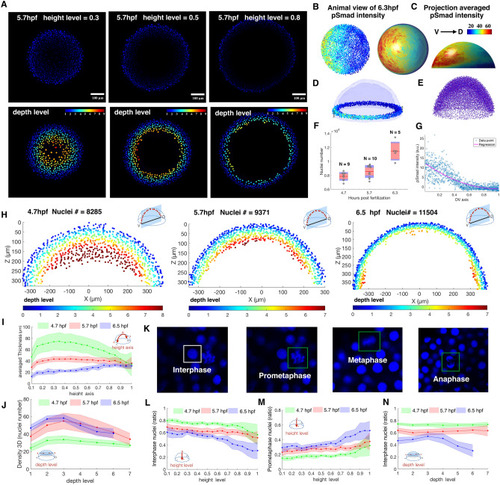
Example quantification of nuclear pSMAD gradient in Zebrafish embryo and spatial analysis of embryo coordinate system, 3D topology features and cell cycle phase patterns between 4.7, 5.7, 6.5 hpf Zebrafish embryo. (A) Z-slice DAPI nuclear stain (upper) and depth level for each nucleus on height level = 0.3, 0.5, 0.8 in 5.7 hpf Zebrafish embryo (lower). (B, C) Animal view of nuclear pSMAD intensity of all nuclei from the 6.3hpf embryo (left), and animal and lateral view of averaged pSMAD intensity by projecting to uniform distributed semisphere surface using WaveletSEG (center and right). (D) Data visualization of nuclear pSMAD intensity for 6.5 hpf Zebrafish embryo in marginal region using WaveletSEG. Light blue and dark blue transparent shells indicate inner and outer boundary surfaces of all nuclei in embryo. (E) Embryo alignment using coherent point drift (CPD) method in WaveletSEG. (F) Nuclei number counts of embryo vs different developmental time (4.7hpf: N = 9, 5.7hpf: N = 10, 6.5hpf: N = 5) which also applied in (i-j, l-n). Gray dots are individual embryo nuclei number. Red line red box region, and blue region show the mean nuclei number, 95% confidence region and region between one standard deviation. (G) Distribution of nuclear pSMAD intensity vs DV axis in embryo margin region in (C). Blue dot and red line indicate individual nuclei intensity and averaged intensity along DV axis. (H) Depth level spatial distribution for nuclei in DV direction cross section plane ± 30 um of 4.7 hpf (left), 5.7 hpf (center) and 6.5hpf Zebrafish embryo (right). (I) Averaged nuclear layer thickness through embryo height axis in 4.7, 5.7 and 6.5hpf embryo developmental time. (J) Averaged nuclear density through embryo height axis in 4.7, 5.7 and 6.5hpf embryo developmental time. Green, red and blue dark line indicate mean value, and light green, light red and light blue regions indicate one standard deviation region. (K) Examples of cell cycle phase in mitosis based on nuclei shape classification results. (L) Interphase nuclei count ratios through embryo height level in 4.7, 5.7 and 6.5 embryo developmental time. (M) Prometaphase nuclei count ratios through embryo height level in 4.7, 5.7 and 6.5 embryo developmental time. (N) Interphase nuclei count ratios through embryo depth level in 4.7, 5.7 and 6.5 embryo developmental time. (L–N) Green, red and blue dark lines indicate mean value, and light green, light red and light blue regions indicate one standard deviation region. |