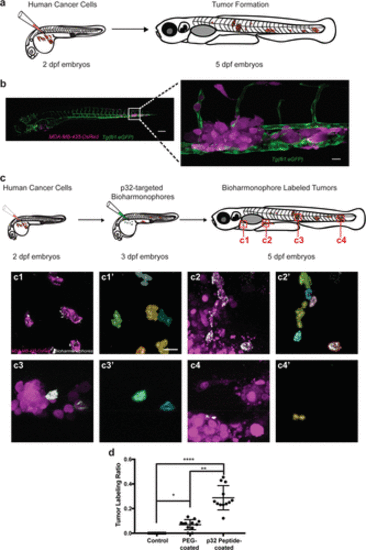
Bioharmonophores can be specifically targeted to single cancer cells in vivo. (a) Schematic showing the generation of a zebrafish cancer model by injecting MDA-MB-435-DsRed cancer cells into the Duct of Cuvier (DoC) at 2 dpf, resulting in tumors spread to multiple locations of the zebrafish body at 5 dpf. (b) Composite image of the cancer model (left) in a 5 dpf old zebrafish embryo. Close-up image of one of the tumor sites (right) reveals DsRed-labeled tumors (magenta), adjacent to the eGFP-labeled vasculature (green). (c) Schematic showing cancer cell injection of 2 dpf zebrafish embryos followed by bioharmonophore injection into DoC of 3 dpf zebrafish embryos and subsequent fluorescence and SHG imaging at 5 dpf. Red rectangles labeled as c1–4 denote the regions of interest that are illustrated in more detail. Individual panels showing the images of labeled cancer cells with the details of bioharmonophore (white) labeling down to single cancer cells (magenta) in solid tumors (c1–4). Colored cell boundary reconstruction of targeted cancer cells using the bioharmonophore SHG signal (c1′–4′). Note that cellular bioharmonophore distribution can in most cases predict cell morphologies. Scale bar, left panel 200 μm, right panel 20 μm (b); 15 μm (c). (d) Quantification of the fraction of SHG-labeled tumors as the ratio of labeled tumors to all tumors in a given zebrafish embryo after PEG- and p32 peptide-coated bioharmonophore injection, respectively. Each data point signifies one zebrafish. Note that active targeting with p32-coated bioharmonophores significantly increases the labeling efficiency (approximately 4-fold). Mean ± s.d. ****, P < 0.0001, **, P = 0.0063, *, P = 0.0470 (nonparametric Kruskal–Wallis test with Dunn’s post hoc multiple comparison). N = 12, pooled from 3 independent experiments.
|

