
Fig. 2
- ID
- ZDB-FIG-210426-38
- Publication
- Sonay et al., 2021 - Biodegradable Harmonophores for Targeted High-Resolution In Vivo Tumor Imaging
- Other Figures
- All Figure Page
- Back to All Figure Page
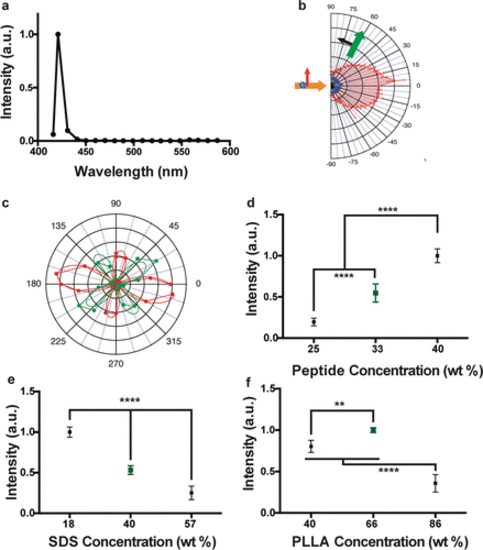
Optical characterization of bioharmonophores and analysis of parameters influencing bioharmonophore formation. (a) Normalized SHG signal spectrum of FFF-based bioharmonophores (signal ranging from 400 to 600 nm) illuminated with 850 nm pulsed laser. The characteristic SHG peak is centered around 425 nm. (b) SHG emission pattern of Triphenylalanine based bioharmonophores. Orange arrow indicates excitation beam direction. Green arrow shows SHG collection direction, which rotates between −90° and +90°. The detected polarization is in the beams plane (P, black arrow). The red pattern shows PPP polarization configuration (excitation and detection polarizations in the plane of the beams), and the blue pattern shows PSS (excitation with a perpendicular polarization). (c) SHG intensity vs incident polarization angle for a bioharmonophore, highlighted by the solid white circle in Supplementary Figure 5. Red color shows detection along the X axis while green color shows detection along the Y axis. The experimental curve is a dotted line, the corresponding fitted curve, assuming C2 symmetry, is a solid line. (d) Influence of using different amounts of FFF peptide during bioharmonophore production on the SHG signal intensity. The optimal condition (33 wt %) is marked in green. The use of higher FFF peptide amount leads to aggregates (n = 5). (e) Influence of SDS concentration (wt % of disperse phase) on SHG intensity of generated bioharmonophores. The optimal condition (40 wt % SDS) with high bioharmonophore stability and less aggregation is marked in green (n = 5). (f) Influence of using different amounts of PLLA during bioharmonophore production on the SHG intensity of the generated bioharmonophores. The optimal condition (66 wt % PLLA) is marked in green (n = 5). Mean ± s.d. ****, P < 0.0001, **, P < 0.005, *, P < 0.05 (ordinary one-way ANOVA with Tukey’s multiple comparisons). |