
Figure 5
- ID
- ZDB-FIG-210414-48
- Publication
- Pronobis et al., 2021 - In vivo proximity labeling identifies cardiomyocyte protein networks during zebrafish heart regeneration
- Other Figures
-
- Figure 1
- Figure 1—figure supplement 1.
- Figure 1—figure supplement 2.
- Figure 2
- Figure 2—figure supplement 1.
- Figure 2—figure supplement 2.
- Figure 2—figure supplement 3.
- Figure 2—figure supplement 4.
- Figure 3
- Figure 3—figure supplement 1.
- Figure 3—figure supplement 2.
- Figure 4
- Figure 4—figure supplement 1.
- Figure 5
- Figure 5—figure supplement 1.
- All Figure Page
- Back to All Figure Page
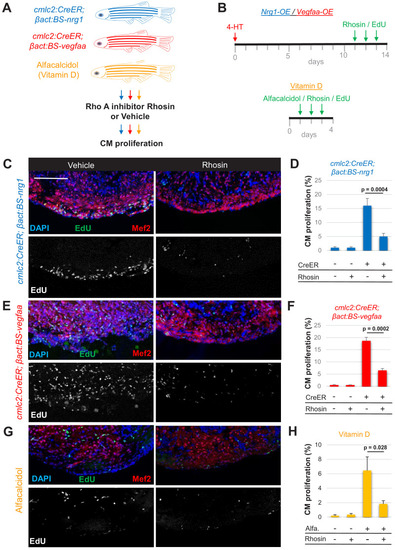
(A) Summary of transgenic animals used in Rho A inhibition experiments. (B) Timeline of experiments for Nrg1-overexpression (OE, blue), Vegfaa-OE (red), and alfacalcidol treatment (orange). (C, E, G) Immunofluorescence images of ventricles stained for Mef2/EdU from animals overexpressing Nrg1 (C) or Vegfaa (E) in cardiomyocytes, or injected with alfacalcidol (G). Hearts were treated with either vehicle or Rhosin. Scale bar, 50 μm. (D, F, H) Inhibition of Rho A by Rhosin reduces cardiomyocyte (CM) proliferation. Quantification of Mef2/EdU staining. Five to six animals were assessed for each group in two independent experiments. Data show mean ± SEM (Mann–Whitney U test). |