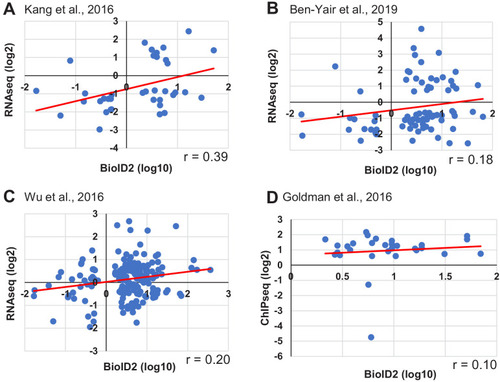
Figure 2—figure supplement 2.

Comparison of the BioID2 data set with published transcriptome or epigenome data sets.

(A–D) The 14 days post incubation (dpi) BirA2-GFP BioID2 data set (normalized to uninjured, p<0.05) was compared to three RNA-seq data sets (Wu et al., 2016; Kang et al., 2016; Ben-Yair et al., 2019) and one ChIP-seq (H3.3) data set (Goldman et al., 2017). For RNA-seq data sets (A–C), expression levels have been normalized to uninjured controls and genes with differences of significance p<0.05 were considered. (A) RNA-seq data set from Kang et al., 2016, where 14 dpi whole hearts were used. 37 genes were identified in both data sets, with a correlation coefficient r = 0.39. (B) RNA-seq data set from Ben-Yair et al., 2019, in which purified gata4-expressing cells were examined for transcriptome changes at 5 dpa. 75 genes were represented in both data sets, with a correlation coefficient r = 0.18. (C) RNA-seq data set from Wu et al., 2016, where 7 days post cryoinjury whole hearts (border zone) were used. 160 genes were identified among both data sets, with a correlation coefficient r = 0.2. (D) ChIP-seq data set from Goldman et al., 2017, in which genes with changes in enrichment for a cardiomyocyte-restricted, tagged H3.3 protein at promoters were used in comparison. Promoters were defined as between 5 kb upstream and 2 kb downstream from the gene start site. FDR < 0.05 for significant differential sites, and p<0.05. 30 genes were identified among both data sets.

Expression Data

Expression Detail
Antibody Labeling
Phenotype Data

Phenotype Detail
Acknowledgments
This image is the copyrighted work of the attributed author or publisher, and ZFIN has permission only to display this image to its users. Additional permissions should be obtained from the applicable author or publisher of the image. Full text @ Elife