FIGURE

FIGURE 4

ID
ZDB-FIG-210403-10
Publication
Moreau et al., 2021 - Deciphering DSC2 arrhythmogenic cardiomyopathy electrical instability: From ion channels to ECG and tailored drug therapy
Other Figures
All Figure Page
Back to All Figure Page
FIGURE 4

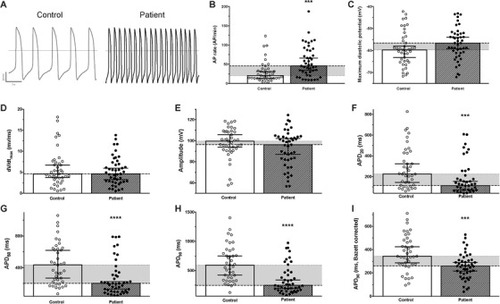
Spontaneous electrical activity of control and patient‐specific hiPSC‐CM. (A) Raw traces illustrating the recording of spontaneous electrical activity (action potentials, AP) of control (left) and patient‐specific (right) hiPSC‐CM. (BI) AP parameters were evaluated for both control (N = 41) and ACM patient‐specific (N = 45) hiPSC‐CM: (B) AP rate, (C) maximum diastolic potential, (D) maximum depolarization slope, (E) AP Amplitude, (F) AP duration at 20% of repolarization (APD20,), (G) APD50, (H) APD90 and (I) the APD90 corrected using Bazett's formula. Histograms represent the median (95% confidence interval). The horizontal grey area illustrates the difference between the control and the patient‐specific conditions. ***p < 0.001 and ****p < 0.0001 (Mann–Whitney test)

Expression Data

Expression Detail
Antibody Labeling
Phenotype Data

Phenotype Detail
Acknowledgments
This image is the copyrighted work of the attributed author or publisher, and ZFIN has permission only to display this image to its users. Additional permissions should be obtained from the applicable author or publisher of the image. Full text @ Clin Transl Med