
Figure 1
- ID
- ZDB-FIG-210327-84
- Publication
- Uriu et al., 2021 - From local resynchronization to global pattern recovery in the zebrafish segmentation clock
- Other Figures
-
- Figure 1
- Figure 1—figure supplement 1.
- Figure 2—figure supplement 1.
- Figure 2—figure supplement 1.
- Figure 3—figure supplement 1.
- Figure 3—figure supplement 1.
- Figure 3—figure supplement 2.
- Figure 3—figure supplement 3.
- Figure 3—figure supplement 4.
- Figure 3—figure supplement 5.
- Figure 3—figure supplement 6.
- Figure 3—figure supplement 7.
- Figure 3—figure supplement 8.
- Figure 3—figure supplement 9.
- Figure 3—figure supplement 10.
- Figure 3—figure supplement 11.
- Figure 4
- Figure 4—figure supplement 1.
- Figure 4—figure supplement 2.
- Figure 4—figure supplement 3.
- Figure 4—figure supplement 4.
- Figure 4—figure supplement 5.
- Figure 4—figure supplement 6.
- Figure 4—figure supplement 7.
- Figure 4—figure supplement 8.
- All Figure Page
- Back to All Figure Page
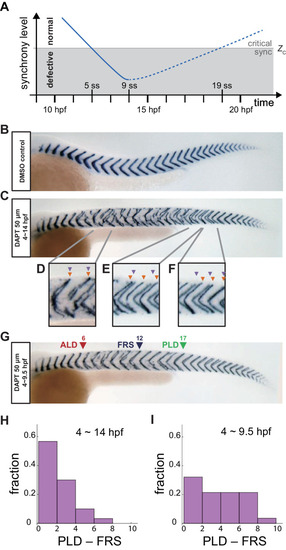
(A) Schematic time series of synchrony level during desynchronization and resynchronization. In the presence of DAPT, the synchrony level decreases due to the loss of Delta-Notch signaling (solid line). DAPT is washed out at 14 hr post-fertilization (hpf; ~9 somite stage; ss) in this panel and resynchronization starts from that time point (dotted line). If the synchrony level is higher (lower) than a critical value Zc, normal (defective) segments are formed. (B) Wild-type control embryo treated with DMSO. (C) Embryo with late DAPT washout at 14 hpf (9 ss). Enlargements of (D) broken or fragmented boundaries, (E) incorrect number of boundaries and (F) left-right misaligned boundaries are shown below. (G) Embryo with early DAPT washout at 9.5 hpf (0 ss). Red, blue and green triangles indicate the anterior limit of defect (ALD), first recovered segment (FRS) and posterior limit of defect (PLD), respectively. (H), (I) Histograms of the difference between PLD and FRS (PLD – FRS) for embryos with DAPT washout at (H) late (14 hpf; n = 30) and (I) early (9.5 hpf; n = 28) stages. Numbers of embryos examined in (H) and (I) were 15 and 14, respectively. FRS and PLD were measured separately between left and right sides of embryos. p<0.05 in Kolmogorov-Smirnov test. |