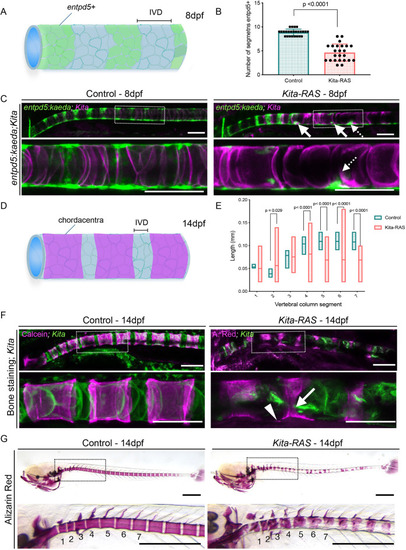
Notochord and sheath destabilisation interfere with vertebral column segmentation and mineralisation in kita-RAS. (A) Diagram illustrating the expression of entpd5(+) in controls. These domains are interspaced by entpd5(−), which will form the intervertebral discs (IVDs), under normal situation. (B) Numbers of entpd5+ segments counted from zebrafish at 5 dpf with length between 3.8 mm and 4.1 mm. Note the slow formation of segments in kita-RAS (n=24) in comparison to controls (n=25). Unpaired, nonparametric t-test and Mann–Whitney test were used. Data are mean±s.d. (C) entpd5 expression in control (kita:mCherry) and kita-RAS at 8 dpf. Maximum projections from z-stacks of notochord (kita) and entpd5:kaeda are shown for merged channels. Selected regions (dashed line boxes) are shown at higher magnification. Note abnormal expression pattern of entpd5 (arrows) coinciding with the wounded region (dashed line arrows). (D) Diagram illustrating where the notochord sheath will mineralise from entpd5+ regions and form the chordacentra (vertebral primordium). (E) The lengths of the first seven segments of the vertebral column were measured from controls (n=24 fish) and kita-RAS (n=23 fish) of similar total length (5 mm≤fish length<6 mm) at 14 dpf. Graph displays seven segments and their lengths. Note the high variability in kita-RAS. Unpaired, nonparametric, multiple t-tests were performed for statistical analysis. Lines indicate the means. P-values are shown when significant (P<0.05). (F) Alizarin Red S and Calcein Green (bone staining) were used to visualise the mineralised chordacentra at 14 dpf in controls and kita-RAS. Maximum projections from confocal images are shown for merged channels. Selected regions (dashed line boxes) are shown at higher magnification. Incomplete mineralisation of the chordacenta (arrow) and ectopic mineralisation towards the IVD domain (arrowhead) were detected in kita-RAS. Scale bars: 100 µm. (G) Alizarin Red S staining was performed on 14 dpf fixed samples for measurements of segment lengths. Note uneven mineralisation of the segments. Selected regions (dashed line boxes) are shown at higher magnification. The first seven vertebral segments are indicated. Scale bars: 500 µm.
|
