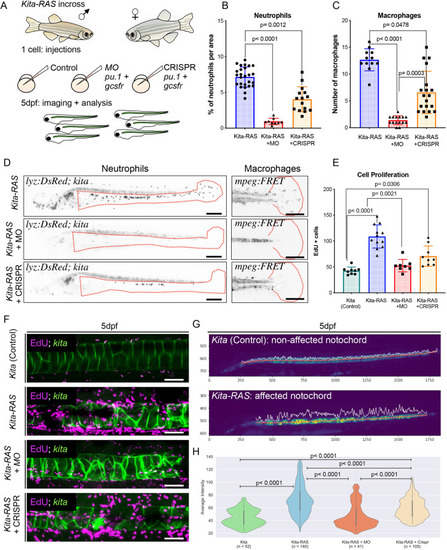
Modulation of the innate immune response prevents chordoma. (A) Schematics of the experiment. kita-RAS-GFP were incrossed, and embryos from the same cross were divided into three groups: controls, morpholinos (MO) or CRISPR targeting pu.1+gcsfr (for depletion of neutrophils and macrophages). Injections were carried out at one-cell stage. The notochords were subsequently imaged and analysed at 5 dpf. (B) Percentage of neutrophils per area in kita-RAS (control group n=26) and kita-RAS injected with either MO (n=9) or CRISPR (n=15). (C) Numbers of macrophages in kita-RAS (n=14) and kita-RAS injected with either MO (n=15) or CRISPR (n=19). (D) For quantification of neutrophils and macrophages, injections were carried out in Tg(lyz:DsRed;mpeg:FRET:kita:mCherry). Percentage of neutrophils was calculated within the selected area (regions within the red dashed lines), after image binarisation. Numbers of macrophages were manually counted in the dorsal fin area (regions within the red dashed lines). Images are displayed with inverted colour and in black and white for better visualisation. Scale bars: 250 µm. (E) Cell proliferation was quantified from confocal images, by counting numbers of EdU+ cells in kita (control) (n=9), kita-RAS (control for injections) (n=12) and kita-RAS injected with MO (n=8) or CRISPR (n=9). (F) Maximum projections from confocal images to show cell proliferation in each of the experimental groups. Scale bars: 50 µm. (G) Computational analysis was performed on images acquired under a stereomicroscope at 5 dpf, and was based on the intensity profile derived from the fluorescence of the identified notochord (red lines). Peaks along the notochord represent the intensity profile. Lesions are identified by higher pixel intensity and broader area under the peak. x- and y-axes show numbers of pixels and serve as scale bars. (H) Violin plot showing quantification of notochord lesions and rescue of notochord phenotype in kita-RAS (control for injections) (n=140) and kita-RAS injected with MO (n=41) or CRISPR (n=105) in comparison to kita (control) (n=52). Note that MO rescued the notochord phenotype, whereas CRISPR injections only partially rescued the notochord. In B, C, E and H, we used nonparametric, one-way ANOVA, Kruskal–Wallis test, followed by Dunn's multiple comparison test. P-values are shown when significant (P<0.05). In B, C and E, data are mean±s.d., generated in Prism 8. H was generated in Python.
|
