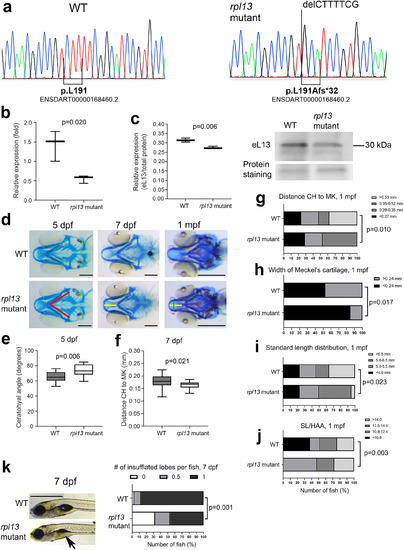
Evaluation of the rpl13L191Afs/L191Afs zebrafish. (A) Sanger sequencing confirmed the genotype of the homozygous rpl13L191Afs/L191Afs (rpl13 mutant) fish. (B) qPCR performed on RNA extracted from three WT and three rpl13L191Afs/L191Afs reveals a partial activation of nonsense‐mediated mRNA decay in mutant zebrafish compared with WT. The p value from Student's t test. (C) WB performed on protein extracts from three WT and three rpl13L191Afs/L191Afs fish reveals reduced expression of eL13 in mutant fish compared with WT. The p value from Student's t test. (D) Alcian blue staining of control (WT) and rpl13L191Af/L191Afs zebrafish at 5 dpf, 7 dpf, and 1 mpf. Compared with WT, cartilage deformities in the head of the rpl13L191Afs/L191Afs are evident. Red lines indicate the ceratohyal (CH) angle, yellow line indicates the distance between the tip of CH and the tip of Meckel's (MK) cartilages, and green line indicates the MK width. Scale bar at 5 and 7 dpf = 200 μm; scale bar at 1 mpf = 500 μm. (E) At 5 dpf, rpl13L191Af/L191Afs show a significant increase of the CH angle compared with WT and (F) at 7 dpf a significant reduction in the distance between the CH and MK cartilages is evident in mutants compared with WT. The p values from Student's t test. (G) At 1 mpf, the frequency of fish with short distance (<0.53 mm) between the CH and MK cartilages and (H) the frequency of fish with narrower MK cartilage were significantly higher in mutants compared with WT. The p values from chi‐square test. (I) Standard length (SL) distribution is significantly different in WT compared with rpl13 mutants at 1 mpf, with a higher number of long fish (>6.5 mm) in the WT population compared with mutants. The p value from chi‐square test. (J) A higher frequency of fish with high SL/HAA (height at anterior margin of anal fin) ratio is found in the mutant group compared with WT group. Morphometric parameters (panels G‐J) were categorized by global quartiles, presented as number of fish (%) in each category, and frequencies analyzed by chi‐square test. (K) Swim bladder inflation in control (WT) and rpl13L191Af/L191Afs zebrafish at 7 dpf. Arrows indicate a partially inflated lobe in mutants compared with WT. Scale bar = 1 mm. Quantitative analysis shows a significant delay in the swim bladder inflation of the first lobe in rpl13L191Af/L191Afs compared with WT. The p values from crosstabs with chi‐square test for frequencies.
|
